

The program that we're going to take a look at is called Wireshark. It's an open source packet sniffer with support for interpreting a vast range of network protocols.
For Windows and Linux, Wireshark can be downloaded from http://www.wireshark.org. On Debian, Ubuntu, RHEL, CentOS, and Fedora it's available as the wireshark package.
You'll need to have root or administrator access in order to install this. On Windows, make sure that you install or update the WinPcap library if it asks you to do so, and also allow it to start the WinPcap driver at boot time when prompted.
On Debian and Ubuntu, you will need to configure Wireshark to allow regular users to run captures. Run the following command:
$ sudo dpkg-reconfigure wireshark-common
Say Yes to Should non-superusers be able to capture packets? Note that this doesn't automatically allow all non-super users to use Wireshark, they still need to be added to the wireshark group. Do this now for your own user, for example:
$ sudo usermod -aG wireshark myuser
You may need to log out and log in again for this to take effect, or possibly even reboot. For other Linux distributions, check their documentation, or there are instructions on the Wireshark wiki for assigning these rights at http://wiki.wireshark.org/CaptureSetup/CapturePrivileges.
If you run into trouble at any point, you can get further help regarding the installation on the wiki at http://wiki.wireshark.org/CaptureSetup.
Once configured, on Linux, just run wireshark in an X session to start the graphical interface.
Once you have Wireshark installed and running, you'll see a window that looks like this:
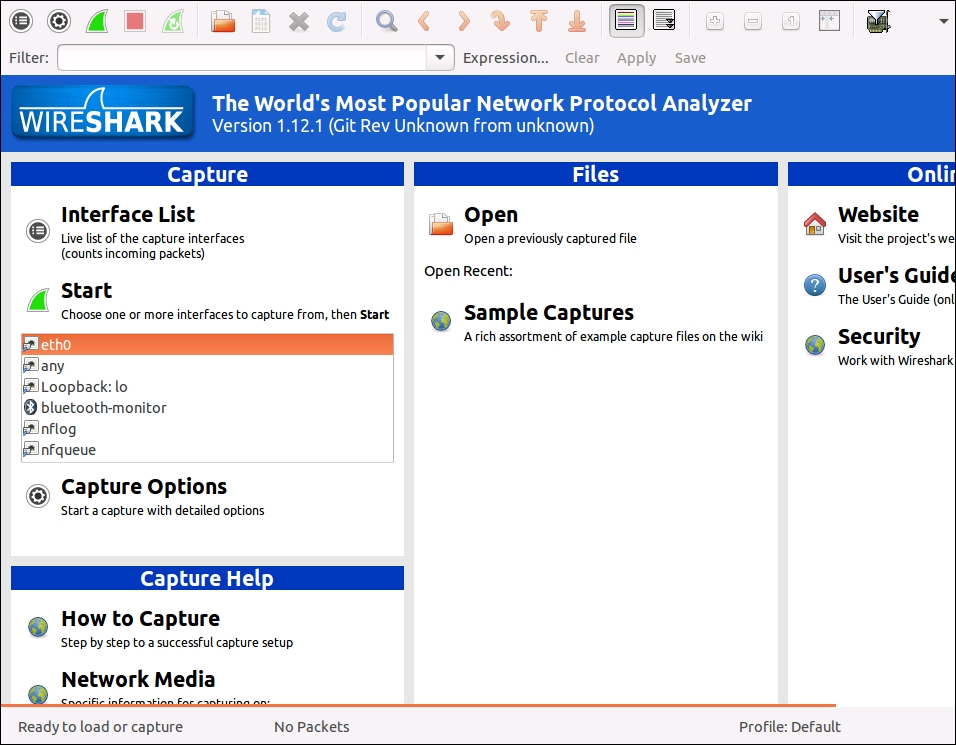
Packet sniffing usually works in two steps: first, we run a traffic capture session, and then we analyze the captured traffic. During a capture, Wireshark asks the operating system for a copy of all the network traffic it processes, which Wireshark then keeps in a buffer for us to analyze. Wireshark provides us with tools that let us filter the captured data so that we can work on only the data streams we want, and drill into each packet in order to take a look at the header data and the payloads.
So first, we need to select the interfaces on which we want to capture the traffic. We can see that there's a list of interfaces below the Start button. Wireshark captures all the network traffic that passes over all the interfaces that we select; this usually means that we end up capturing a lot of data that we're not actually interested in. In order to reduce this noise, it's best to capture as few interfaces as possible, ideally just one.
We're going to use the first RFC downloader, from Chapter 1, Network Programming and Python, RFC_downloader.py, to generate some network traffic to analyze. Since this program communicates with a host on the Internet, we want to capture the network interface that provides our Internet connection.
If you're not sure which interface is your Internet interface, then click on the Interface List button above the Start button to bring up the window, as shown in the following screenshot:
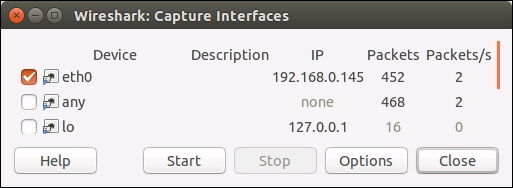
On the right-side of the dialog box, you can see the live counts of the number of packets that have passed through each of the interfaces, since we opened the window. You can generate some Internet traffic by browsing a website if there's not much happening. The interface with the fastest rising packet count will be the Internet interface (ignore the any interface on Linux). Make a note of the interface's name and close the window.
Network interfaces can capture packets in one of two modes: promiscuous mode and non-promiscuous mode. In promiscuous mode, the interface will pass all traffic that it receives on to the sniffer, even if it is traffic that is not destined for our computer. In non-promiscuous mode, the interface filters out any traffic that is not for our computer. Unless you have a very specific reason to, it's usually best to run in non-promiscuous mode, as this reduces the amount of extraneous traffic we need to filter manually. Wireshark enables promiscuous mode by default. To disable, go into Capture | Options... and ensure 'Use promiscuous mode on all interfaces' is unticked. Then check the 'Prom Mode' column in the interfaces list at the top of the options window, and ensure it's says disabled for the interfaces you're capturing on. When done, close the options window to return to the main screen.
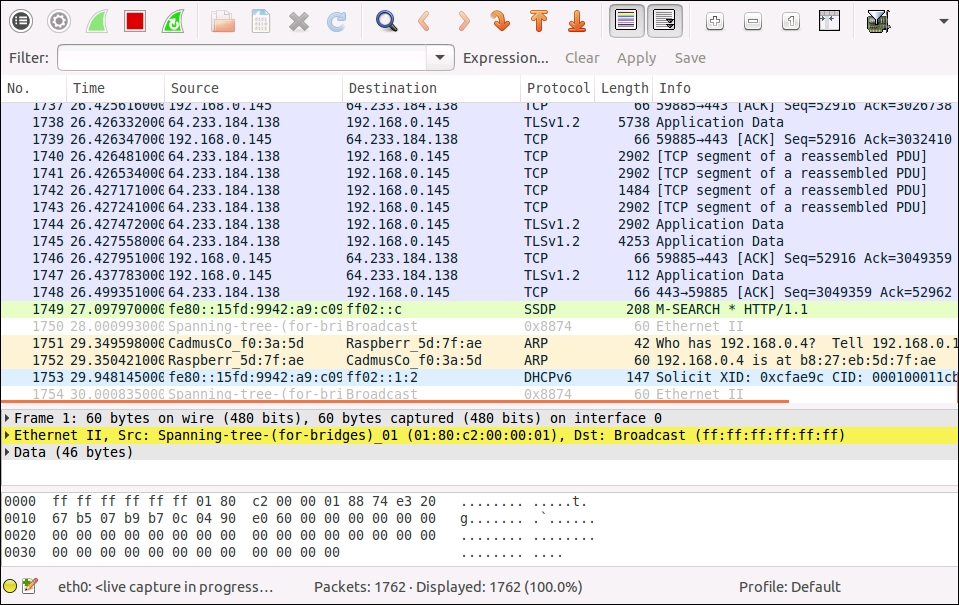
Select your Internet interface from the interface list, which is below the Start button on the main screen, and click on Start to begin a capture. After a moment or two, we should see some packets coming in:
While Wireshark is capturing packets, let's generate some traffic that we're interested in analyzing. Run the RFC_downloader.py RFC downloader program in a terminal to download RFC 2324:
$ python3 RFC_downloader.py 2324
...
Network Working Group                                     L. Masinter
Request for Comments: 2324                               1 April 1998
Category: Informational
...
Once the download has run, return to Wireshark and stop the capture by clicking on the Stop button in the toolbar. If something goes awry with the capture, don't worry, we can try it again; just stop the capture, then click on the Start a new live capture button in the toolbar, and don't save changes to the previous capture when prompted. When it's running, run RFC_downloader.py again. Once you have a capture that contains the RFC downloader traffic, let's take a closer look at it.
As shown in the preceding screenshot, the Wireshark capture screen is broken into three sections. The top section lists the captured packets, one packet per row, and provides basic information for each packet, such as the source and destination addresses, and the name of the highest layer protocol for which the packet contains data.
The middle section contains a breakdown of the protocols present in the selected packet. The top line is equivalent to layer 1 in the network stack, with subsequent lines corresponding to the higher layers.
The bottom section contains a raw listing of the entire captured packet. This is broken into three main vertical areas. The numbers in the first column on the left-hand side are the byte offsets in hex of the start of the line from the beginning of the packet. The middle section consists of two columns of 8 hexadecimal numbers each; this section shows each byte in the packet as a hexadecimal integer. The section on the right-hand side, consisting of two columns of ASCII characters, is the ASCII representation of the bytes in the packet. Dots are used here, where a byte value maps to a nonprintable character.
Let's see if we can find the packets that our downloader program has generated. There's probably a fair amount of extra network data in the capture, so first, we need to filter this out.
Wireshark lets us filter using any property of any of the protocols it supports. To filter, we use the filter box that is under the toolbar. Wireshark has a complete filter language, which you can investigate with the help system. For now, we're just going to do a few basic queries to find our packets. Type http in the filter box, and click on the Apply button. This restricts the displayed packets to just those that involve the HTTP protocol, as shown in the following screenshot:
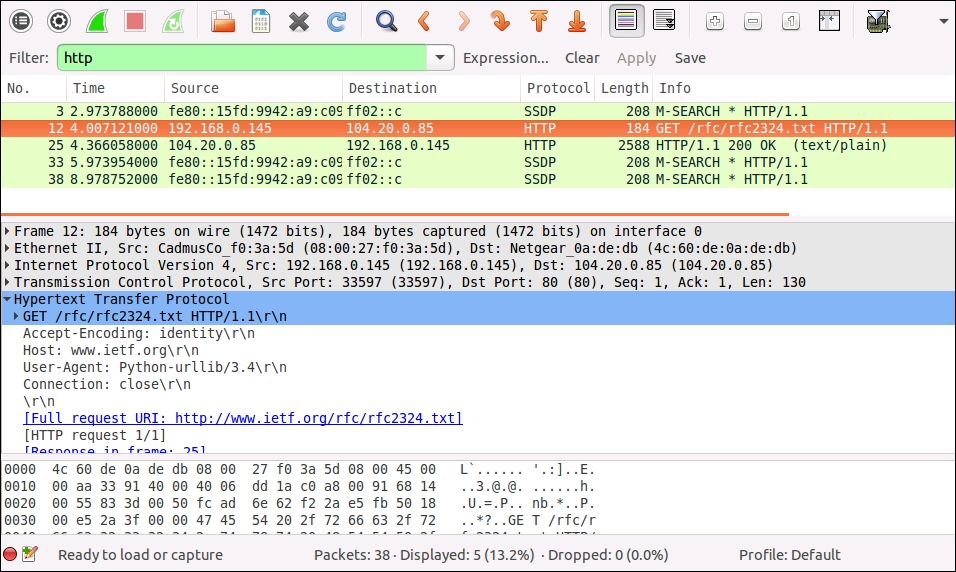
Even if the only HTTP traffic that you deliberately generated during the capture session was through the downloader program, it's possible that we'll see more HTTP packets than just those. This is because some programs, such as file cloud storage clients, communicate with their services in the background quite frequently through HTTP. Also, Wireshark currently identifies SSDP protocol packets as HTTP, since SSDP is derived from HTTP.
Not a problem though, we can refine our filter. The unique identifying feature of our downloader packets is the server that we communicated with, www.ietf.org. If we take a look at the packet list, you can see that the source and destination addresses of the captured packets are IP addresses, so before we write our new filter, we need to find out the IP address of www.ietf.org.
Retrieving the IP address of a hostname is called
name resolution, and this is exactly the task that DNS was designed for. There are several mechanisms that we can use to interact with DNS. On Linux and Windows, we can use the nslookup command-line tool. Run the following command:
$ nslookup www.ietf.org
Server:        127.0.1.1
Address:       127.0.1.1#53

Non Authoritative answer:
www.ietf.org    canonical name = www.ietf.org.cdn.cloudflare-
                                 dnssec.net.
Name:   www.ietf.org.cdn.cloudflare-dnssec.net
Address: 104.20.1.85
Name:   www.ietf.org.cdn.cloudflare-dnssec.net
Address: 104.20.0.85
The output indicates that www.ietf.org is actually hosted at two IP addresses: 104.20.1.85 and 104.20.0.85. This is becoming increasingly frequent as more websites deploy load balancing and content delivery networks to spread the workload across servers.
A quick glance at our captured HTTP packets list will probably allow us to see which server we ended up connecting to. In the preceding example, it's 104.20.0.85. However, to make sure, we can filter for both the IP addresses.
Note that nslookup may return different IP addresses than those shown in the preceding example. Web services can change IP addresses of their servers for various reasons.
So now, we can filter for www.ietf.org. Using the IP addresses you just resolved, enter this new query in the filter box:
http and (ip.addr == 104.20.1.85 or ip.addr == 104.20.0.85)
Click on the Apply button again. This query adds the extra condition that, as well as involving the HTTP protocol, packets must have an IP source or destination address of either 104.20.1.85 or 104.20.0.85.
The ip.addr syntax is a typical example of filtering on a property of a protocol. There are many more. For example, if we want to filter by just the source address rather than both the source and destination addresses, we can use the following command:
http and (ip.src == 104.20.1.85 or ip.src == 104.20.0.85)
To explore all the available protocols and their properties, click on the Expression... button to the right of the filter box. In the left-hand pane of the window that appears, we can see all the protocols listed, and we can expand one by clicking on the corresponding triangle or + symbol, which will show its properties. In this window, IP is listed as IPv4.
Getting back to our RFC downloader packets, let's close the expression window if it's open, and turn our attention to the main window. After applying the http and (ip.addr == 104.20.1.85 or ip.addr == 104.20.0.85) filter, we should see two packets listed in the top section of the screen:
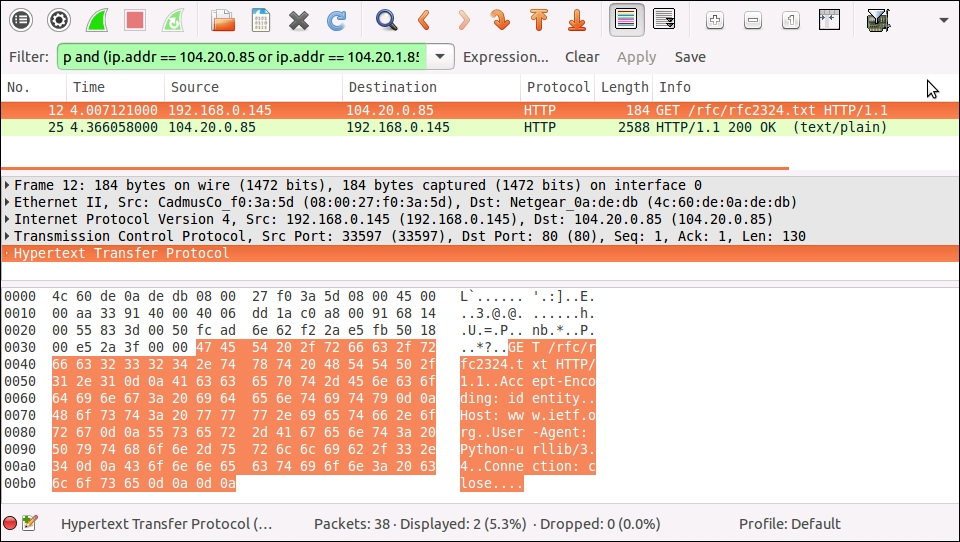
The first is the HTTP request that urlopen() sent to the server, and the second is the server's HTTP response.
Click on the first packet to select it, and turn your attention to the middle section of the window. We can see five lines of information. Each corresponds to a layer in the network stack and the protocol that is being used in this layer. While keeping an eye on the raw listing of the packets in the bottom section of the screen, click on the different lines in the middle section. You'll see that different areas of the raw packet listing get highlighted. The highlighted areas are the sections of the raw packet that are relevant for the protocol that you clicked on. For the first layer (the line beginning in Frame), it highlights the whole packet, since the whole packet is what's sent over the wire. For the last layer, Hypertext Transfer Protocol, it highlights the section of the packet that is the HTTP request, as shown in the preceding example. For the layers in between, it just highlights the header for that protocol's encapsulated packet.
We can drill into the header data for each encapsulated packet by clicking on the triangle or + symbols to the left of each protocol line in the middle section. If we do this for the Hypertext Transfer Protocol line, we get something like this:
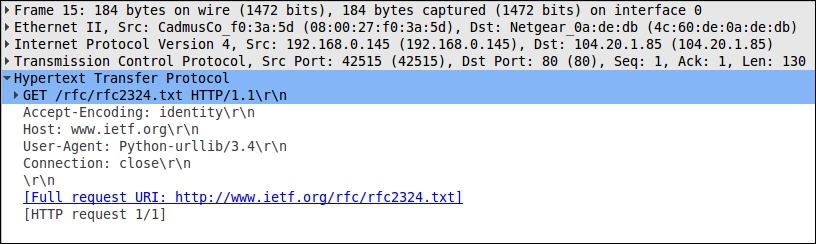
The HTTP headers in our request have been interpreted by Wireshark and broken out to make them more readable. You can explore the other protocols' data in the same way.
Let's inspect the second packet that we captured, the HTTP response. Click on it now in the top section of the window:
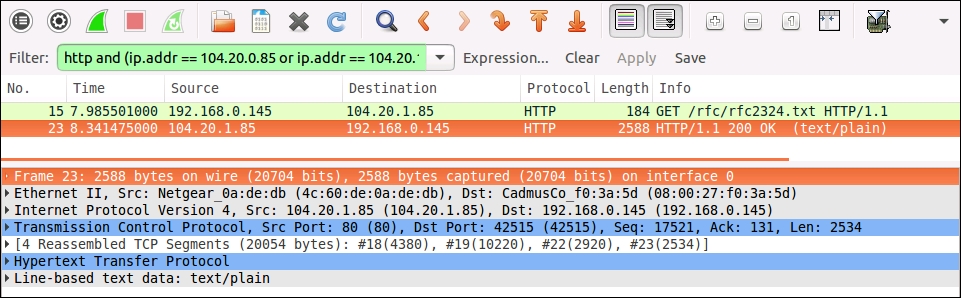
You'll notice some extra lines for this packet in the middle section. The line that refers to reassembled TCP segments indicates that the HTTP response was actually large enough to be broken across four TCP packets. Wireshark recognized this and reassembled the full HTTP packet by combining the relevant TCP packets, so when we click on the Hypertext Transport Protocol line, we see the whole HTTP packet.
Note
If you don't see this, you may need to switch it on in the options menu. Go to Edit | Preferences… to bring up the preference window, then expand Protocols in the list on the left-hand side of the screen, and scroll down and find HTTP. Make sure that both the options that mention spanning multiple TCP segments are checked.
Finally, the Line-based text data line shows us the response content media type (described in Chapter 2, HTTP and Working with the Web), and expanding the line shows us the text data of the body of the response.
As you'll probably notice from browsing the menus, Wireshark is a very feature-rich network analyzer, and we've barely even scratched the surface of its full capabilities. I encourage you to keep it handy as you work with this book, and do use it wherever you'd like to take a closer look at the data being sent or received over the network.