

Introducing PromQL
Prometheus was initially developed by SoundCloud in 2012; the project was accepted by the Cloud Native Computing Foundation in 2016 as the second incubated project (after Kubernetes), and version 1.0 was released shortly after. PromQL is an integral part of Prometheus, which is used to query stored data and produce dashboards and alerts.
Before we delve into the details of the language, let’s briefly look at the following ways in which Prometheus-compatible systems interact with metrics data:
- Ingesting metrics: Prometheus-compatible systems accept a timestamp, key-value labels, and a sample value. As the details of the Prometheus Time Series Database (TSDB) are quite complicated, the following diagram shows a simplified example of how an individual sample for a metric is stored once it has been ingested:
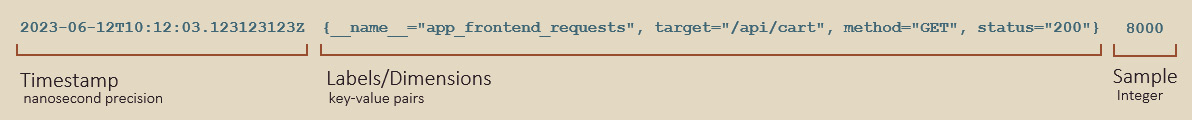
Figure 5.1 – A simplified view of metric data stored in the TSDB
- The labels or dimensions of a metric...