

Monitoring GCP using Grafana
Grafana Cloud comes with support for Google Cloud Monitoring, allowing you to query, trigger alerts, and visualize your data in Grafana dashboards. It does not store any telemetry data in Grafana; it only retrieves it at query time.
Let’s now look at the steps for configuring the data source.
Configuring the data source
Data sources can be accessed from the menu under the Connections item. Search for Google Cloud Monitoring in the Data sources search box; you will see a screen similar to the one shown in Figure 7.11. Click on Google Cloud Monitoring to open the settings page. The settings screen prompts for the Google configuration needed to establish and test the connection. The Connections search results screen is shown here:
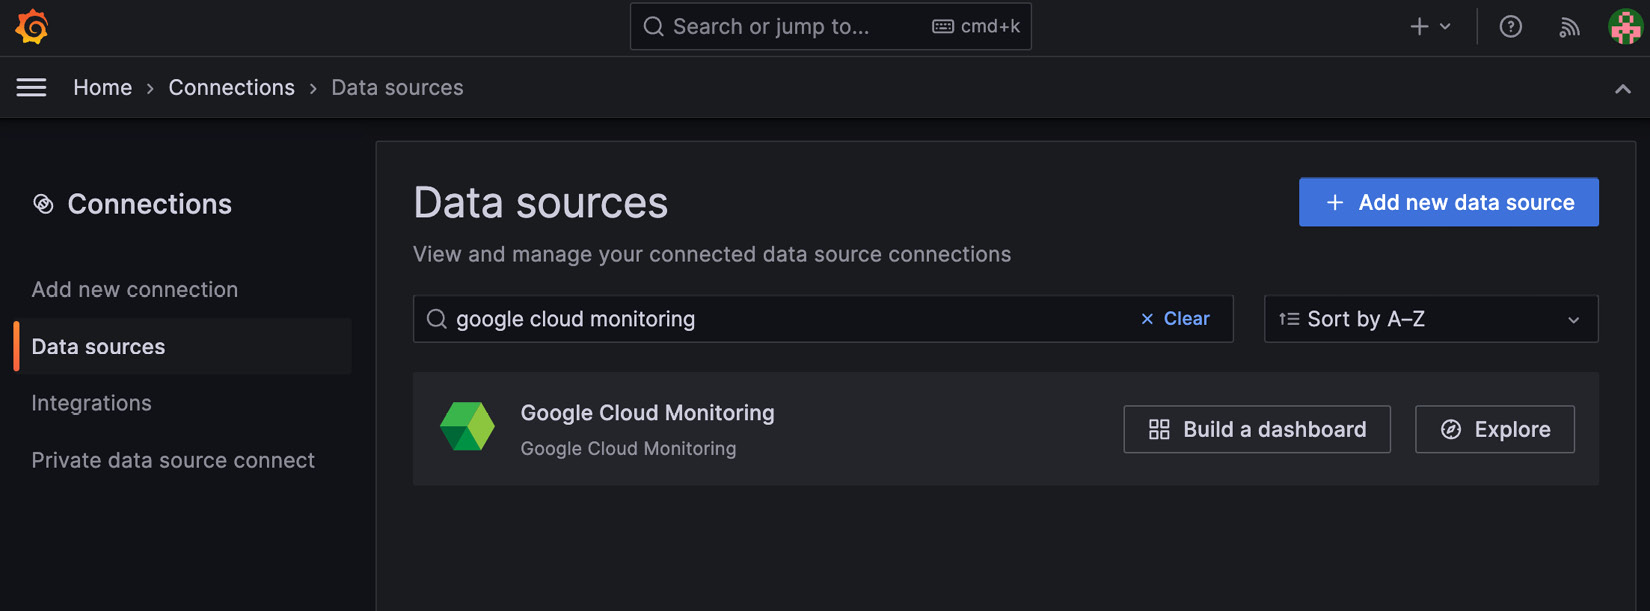
Figure 7.11 – Connections search results screen
The configuration settings for Google Cloud Monitoring shown in the following screenshot walk you through the configuration, helping...