
Management of Azure infrastructure (and more)
The last part of the cloud migration and adoption process, regarding IaaS, is providing a solution that allows for enterprise-ready management of your Azure landscape. And where possible, this should be stretched to a hybrid management solution, especially during a longer migration period, where you have systems running in your on-premises datacenter but also in Azure.
Azure comes with a plethora of management, monitoring, and operations tools. Let me walk you through a few of these that you will most probably start using immediately on a day-to-day basis.
Azure Monitor
Azure Monitor provides a unified monitoring solution for Azure, offering a single place to go to extract insights from metrics such as CPU consumption, logs, including event and application logs, and any other telemetry information generated by Azure services. This can be extended to also monitor on-premises running workloads and solutions, resulting in a single, powerful monitoring tool.
Azure Monitor also offers advanced diagnostics and analytics, powered by machine learning. These are surfaced in Azure services such as Azure Monitor for virtual machines, Azure Monitor for Containers, Azure Advisor, and Azure Security Center, to name just a few. Each and every one of these canonical scenarios offers recommendations and insights into how your deployment of Azure resources is performing.
Monitoring in Azure typically falls into two categories: monitoring fundamentals, which are components that are available in the Azure platform automatically without having to enable any services, and scenario-specific monitoring, which includes services within the Azure platform that can be utilized for monitoring but will require additional configuration or may include additional costs. Examples of this would be Azure Monitor Log Analytics, which has a free tier and consumption-based pricing, or Azure Security Center, which also has a free tier and a paid tier. Azure Monitor is part of Microsoft Azure's overall monitoring solution. Azure Monitor helps you track performance, maintain security, and identify trends.
Azure Monitor enables you to consume telemetry to gain visibility into the performance and health of your workloads on Azure. The most important type of Azure telemetry data is the metrics (also called performance counters) emitted by most Azure resources. Azure Monitor provides several ways to configure and consume these metrics for monitoring and troubleshooting.
Azure Monitor information is based on two main log information types, metrics and logs. Metrics are numerical values, typically used for getting real-time feedback. Logs, on the other hand, contain much more detail and are typically used for retrieving or pinpointing correlations between events and activities. Logs would also be stored for a longer period of time, often depending on the compliance requirements of an organization.
Typical metrics for an Azure resource are published in the Overview section of an Azure resource (see Figure 15 for an example related to Azure web apps).
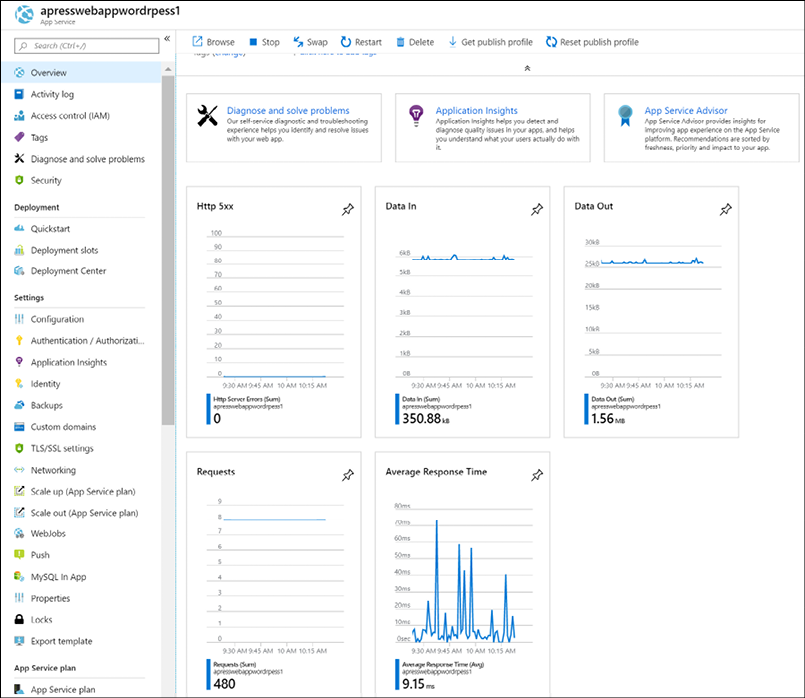
Figure 15: Azure web app resource metrics
Retrieving more complex data from stored logs is done using Azure Monitor Log Analytics, where one needs to use Kusto query language-based queries. An example of what such a query looks like is shown in Figure 16.
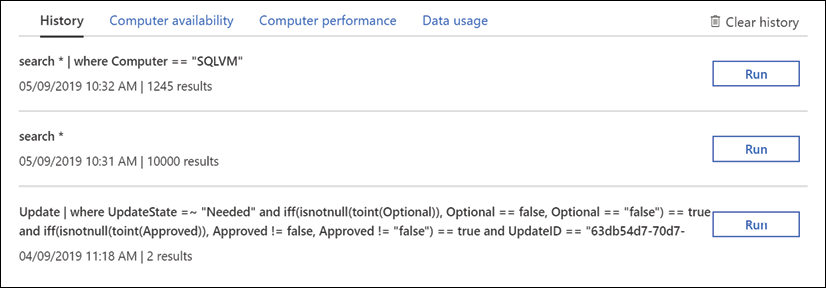
Figure 16: Azure Monitor Log Analytics query example
See https://bit.ly/2QFzeyJ for more information and details.
Azure Monitor Log Analytics
Azure Monitor Log Analytics was previously treated as its own service in Azure, known as Operations Management Suite (OMS) Log Analytics. It is now considered a part of Azure Monitor and focuses on the storage and analysis of log data using its query language. Features that were considered part of Log Analytics, such as Windows and Linux agents for data collection, views to visualize existing data, and alerts to proactively notify you of issues, have not changed but are now considered part of Azure Monitor.
You require a log query to retrieve any data from Azure Monitor Log Analytics (Figure 17). Whether you're analyzing data in the portal, configuring an alert rule to be notified of a particular condition, or retrieving data using the Log Analytics API, you will use a query to specify the data you want.
You can create alerts based on your queries, and because you can include Azure metrics data in Log Analytics, you can even perform queries across your metrics and data stored in the Log Analytics service.
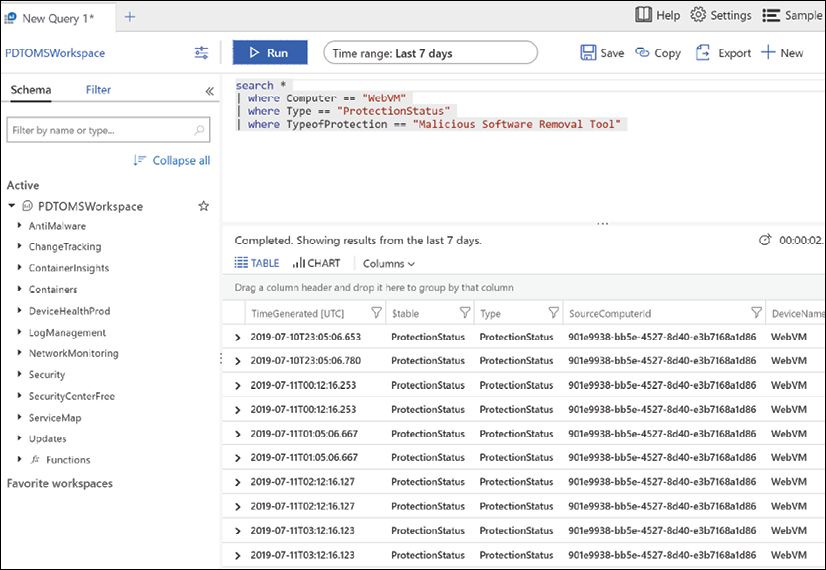
Figure 17: Azure Log Analytics query
Log sources are ingested from multiple services as well, just like metrics. In fact, metrics, along with activity and diagnostics logs, can serve as a data source for Log Analytics. Telemetry for virtual machines can be richer, as Log Analytics includes both textual and numeric data types, allowing for application logs, event logs, and additional performance metrics to be written to Log Analytics. The same is true for application data for custom applications. Applications can be instrumented with Application Insights to provide deep insights into application performance and health. Azure Security Center also leverages Log Analytics as a part of its analysis of the virtual machines in your subscriptions. When onboarding a VM to Security Center, you're in fact onboarding that machine to a Log Analytics workspace where its telemetry is stored for analysis by Security Center. There are also marketplace solutions that extend a Log Analytics workspace, bring additional data points into the service for a query, as well as new visualizations based on those data points.
Finally, you can interact with and respond to events based on Log Analytics data with services such as Azure Automation, where you can have an event trigger a runbook or even a webhook in an Azure function.
Azure Security Center
Azure Security Center (Figure 18) provides unified security management and advanced threat protection across hybrid cloud workloads. Many organizations are moving workloads to the cloud or deploying new workloads in the cloud to optimize their security posture.
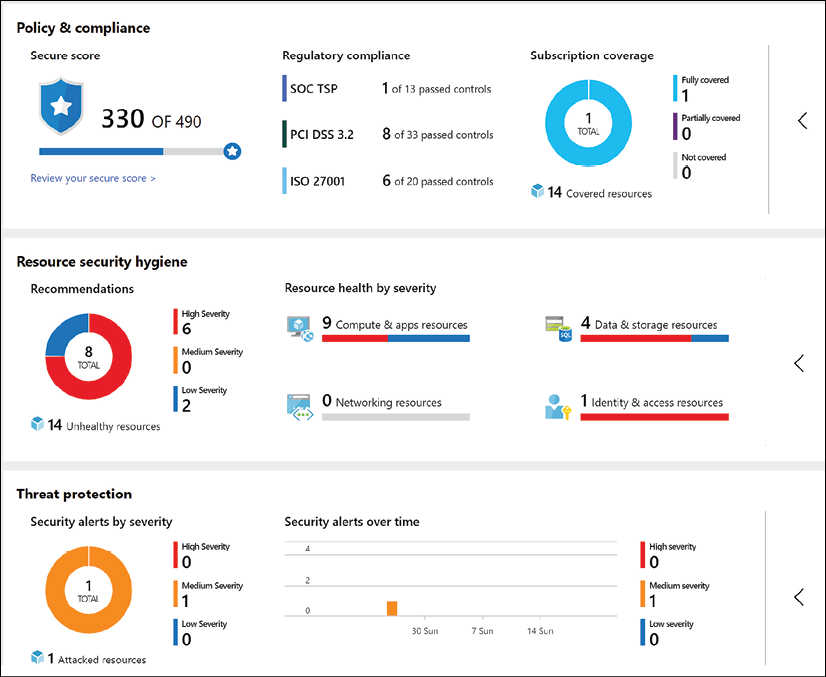
Figure 18: Azure Security Center
Azure Security Center offers powerful capabilities across three main areas:
- Cloud Security Posture Management: Azure Security Center provides you with a top-down security posture view across your Azure environment, enabling you to monitor and improve your security posture using the Azure Secure Score. Security Center can help you identify and perform security best practices and hardening tasks and implement them across your machines, data services, and apps. This includes managing and enforcing your security policies and making sure your Azure virtual machines, non-Azure servers, and Azure PaaS services are compliant. With newly added IoT capabilities, you can also reduce the attack surface for your Azure IoT solution and fix issues before they can be exploited. In addition to providing full visibility into the security posture of your environment, ASC also provides visibility into the compliance state of your Azure environment against common regulatory standards.
- Cloud Workload Protection: Azure Security Center's threat protection enables you to detect and prevent threats at the IaaS layer as well as in PaaS resources in Azure such as IoT and App Service, and finally with on-premises virtual machines. Key features of Azure Security Center threat protection include config monitoring, server EDR, application control, and network segmentation. Azure Security Center also supports container and serverless workloads.
- Data Security: Azure Security Center includes capabilities that identify breaches and anomalous activities against your SQL databases, Data Warehouse instances, and storage accounts, with support for other services on the way. In addition, Security Center helps you perform the automatic classification of your data in Azure SQL Database.
Security is part of all layers of the public cloud environment. The good news is that Azure Security Center has the capabilities to tackle and report on each of these layers in an Azure environment, as well as in a hybrid cloud scenario.
Azure Sentinel
While Azure Security Center is mainly used as a reactive operations tool, many organizations are struggling to switch to a reactive approach. This is where Azure Sentinel can be of value. Azure Sentinel is a Security Information and Event Management (SIEM) tool in the cloud. Given the huge amounts of security-related data out there, it is important to get a clear view and focus on the key concerns and how to fix them. A lot of different Microsoft services, such as Azure, Office 365, and also non-Microsoft services, can report information back to Sentinel.
All this information goes through a massive data analytics and machine learning engine, helping to identify threats. Also, it comes with more than 100 built-in rules, and you can configure your own alert rules.
When one or more incidents (cases) occur, they will be centralized to allow for further investigation and handling. With a powerful graph view, it becomes easier to present and detect the correlation between stand-alone attacks and vulnerabilities. And all of this is available cross-platform, whether checking Azure resources, on-premises, or hybrid.
Besides the dashboarding views and detections, Azure Sentinel can also help in remediation. Using Security Playbooks—backed by Azure Logic Apps—it doesn't take more than a few clicks to build a step-by-step logical approach of action-taking.
Lastly, a huge community of Microsoft and non-Microsoft security experts and organizations helps to maintain and optimize security detections, centralized in the Sentinel GitHub repo, https://bit.ly/302Yfqq, resulting in an even more powerful security service.
Azure Network Watcher
A core activity as part of managing your own datacenter is getting a clear view of your network traffic, not only from a security perspective but also regarding bandwidth, latency, and suchlike. Vendor tools such as Wireshark and Fiddler have been part of any IT admin's troubleshooting toolbox for years. While these tools are still useful in an Azure environment, they do not always give the same rich, detailed experience. The main reason for this is because you don't own and control the Azure network stack as you do in your on-premises datacenter. There are no firewalls or switches that you can connect a serial console cable onto in order to capture network traffic or read out syslog information.
And that is where Azure Network Watcher (Figure 19 gives a dashboard view of Network Watcher integration with Azure Monitor) comes in. Bringing in a lot of typical network trace features, it is a must-use tool if you take Azure network monitoring seriously:
- IP flow verify: Allows you to get a clear view on the matter if a packet is allowed or denied to or from a virtual machine, using five-tuple information
- Next hop: Provides the next hop from the target virtual machine to the destination IP address
- Effective security rules: Shows the effective rules, based on different Network Security Group (NSG) rules, configured on different levels (NIC, subnet, and so on), thereby making it easy to troubleshoot and see the effective reason why traffic is allowed/denied
- VPN troubleshoot: Diagnoses the health of site-to-site VPN gateways and ExpressRoute, capturing details in a diagnostic log file
- Packet capture: Similar to Wireshark, runs packet captures to analyze all the details of the network stack
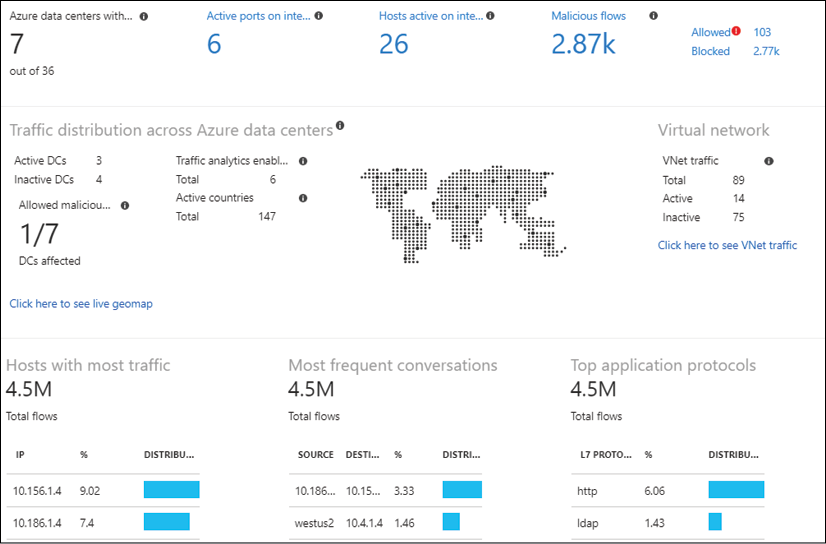
Figure 19: Azure Network Watcher connection monitor
Azure Service Health
Sometimes you face an issue or downtime with one of your running Azure workloads. But this is not always caused by your administrators. Like any other datacenter, Azure undergoes continuous updates and requires patching of its infrastructure. Physical components fail all the time, especially if you consider the amount of physical servers, storage, networking, and racks that are running inside each and every Azure region. To help you in troubleshooting, as well as to legally identify you about any issues being faced by the PaaS provider, Azure gives you Azure Service Health (Figure 20). From here, you can get a real-time view of the overall uptime status of any Azure datacenter you have services running with, as well as historic views. If you detect an issue with a workload or service whose configuration has not been changed by yourself, it should be a reflex to open Azure Service Health and validate that all is fine on the Azure physical stack.
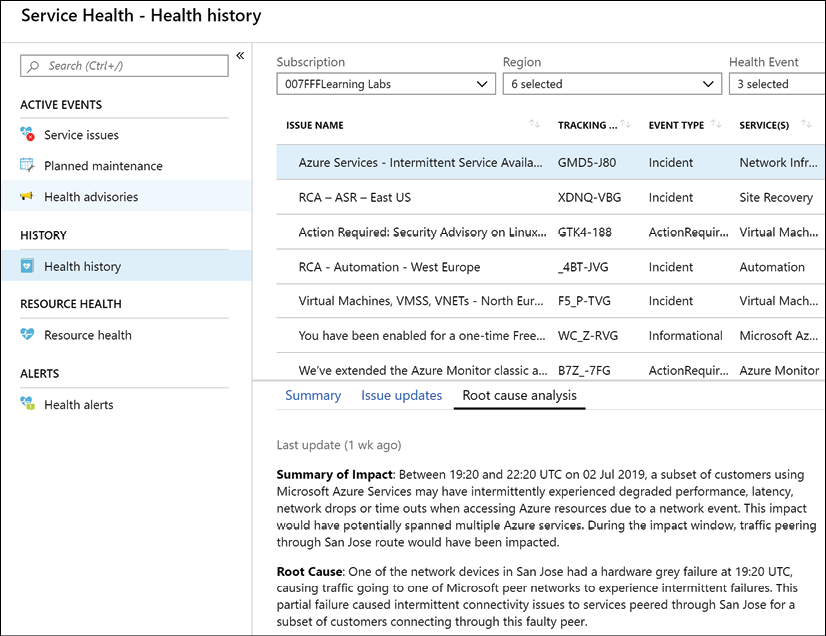
Figure 20: Azure Service Health
Azure Advisor
Azure Advisor is yet another Azure monitoring tool, and it is a great one. First of all, it's free, but that's not the main reason why any Azure customer should enable and use it in their subscriptions.
Azure Advisor provides insights and recommendations in four domains:
- High availability
- Security
- Performance
- Cost
All of this is presented in a nice Azure dashboard (Figure 21), allowing you to drill down to see more details regarding the recommendations.
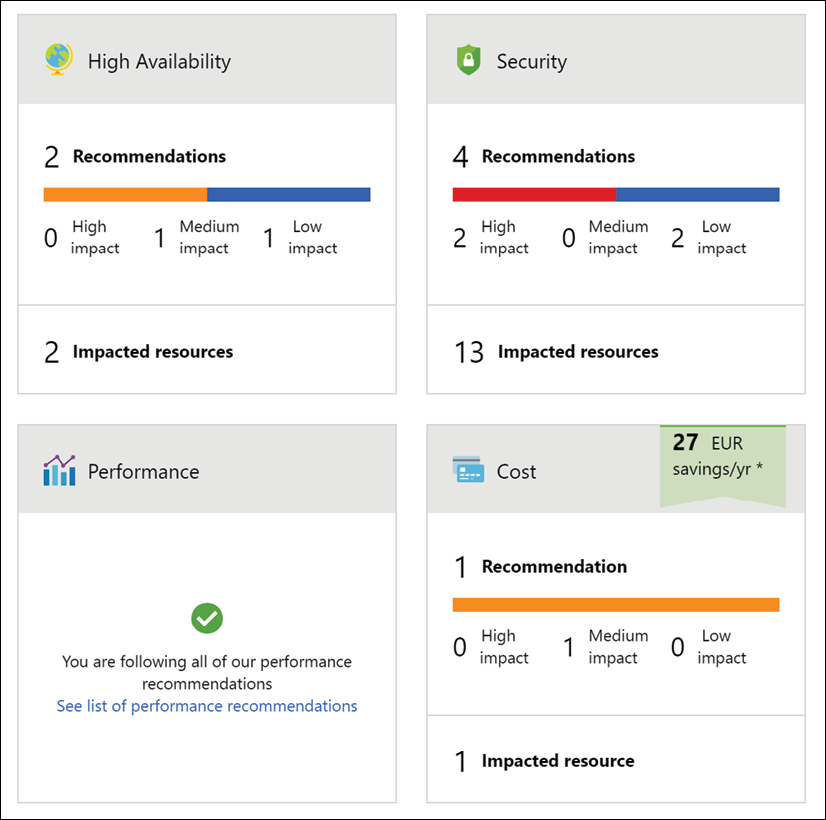
Figure 21: Azure Advisor
The core idea of Azure Advisor is getting guidance on using Azure best practices, helping you optimize running workloads and services in Azure. Based on machine learning in the back end and relying on telemetry information and configuration settings from your actual Azure environments, it will provide recommendations for optimization.
While it would be possible to go after that information yourself, it is probably a lot more time-consuming and cumbersome to find than what Azure Advisor presents nicely and almost in real time, without any hassle or agent needing to be deployed.
Azure Monitor Application Insights
Azure Monitor Application Insights is yet another Azure monitoring tool, with a core focus on monitoring your (web) application landscapes, no matter where they are running. And that is immediately one of the main reasons why you should have a look at it. Although running in Azure, the to-be monitored web apps don't need to run in Azure App Service. Next, it is a very detailed tool, capturing most of the insights a developer is looking for when running web applications. It detects information regarding web app performance, but also helps in analyzing web app traffic. From a language perspective, most popular environments and development languages are supported (.NET, Java, Node.js, Python, Ruby, and more).
You install a small instrumentation package in your application and set up an Application Insights resource in the Microsoft Azure portal. The instrumentation monitors your app and sends telemetry data to Azure Monitor. (The application can run anywhere—it doesn't have to be hosted in Azure.)
Information that Azure Monitor Application Insights is capable of tracking and presenting includes:
- Web app response times and failed requests
- Exceptions in traffic or usage
- Page views and load performance
- Custom metrics, if configured
It allows you to work with four domains of web app hosting:
- Monitoring (availability, performance, and integration with other services such as databases)
- Detecting and diagnosing issues (HTTP errors, providing traces, and so on)
- Synthetic transactions (running web tests)
- Telemetry information
The different sections that are monitored by Azure Monitor Application Insights can be presented in clear and customizable dashboards (see Figure 22 for an example), which can be shared among your Azure administrators.
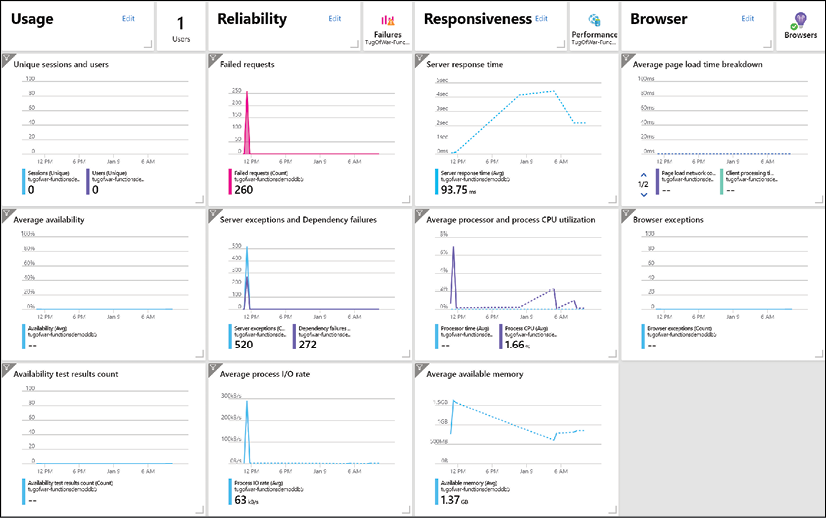
Figure 22: Azure App Insights