

Managing a network is equally as compelling as security; Citrix provides its own command center (CC) as a monitoring and manageability solution. This recipe shows what monitoring can be done on the NetScaler alone as well as how CC helps with the (simple network management protocol) SNMP polling.
Note
The CC is used to smartly manage the network when there are multiple NetScaler devices.
It is used to manage the Citrix NetScaler, Access Gateway and App Firewall devices. It is a software solution that sits on the Linux or Windows systems. It has its own database or can be pointed to any external database.
Listed here are the functions of the Citrix CC:
Fault management
SSL certificate
Planned upgrade/downgrade of devices
Collecting events and faults of devices on a regular basis can be done with the help of the CC, although NetScaler also has a basic level monitoring applet from which we can view the connections per second under load balancing, content switching, and so on.
The ports that are needed to be open between the CC server and NetScaler are as follows:
SNMP ports 161 and 162
SSH and SFTP (that is, 22)
If the GUI configuration utility and dashboard need to be accessed from the CC client, port 80 and 3010 need to be allowed
When the CC server is installed, HTTPS is enabled by default
HTTP communication between CC client and NetScaler is 9090
The discovery process of the CC as well as the event logs of a device is automatic.
In this section, we will start with monitoring done on NetScaler and continue further with how to enable discovery automatically in the command center.
On the Netscaler Configuration Utility, there are three tabs: Configuration, Monitoring, and Reporting Dashboards.
The SNMP part of the config on NetScaler is simple and straightforward:
Go to System | SNMP. The first step in SNMP is to configure a community name on NetScaler. The default community name is "public". The version of SNMP configured should be the same on NetScaler and the SNMP manager.
The SNMP manager needs to be configured on NetScaler.
Necessary traps it is required to send can also be configured in the Config utility under System | SNMP | Traps:

We can also classify traps by enabling the alarms to send logs with different severity such as Critical, Warnings, Information, and so on. The source IP address for sending these traps is by default the NetScaler IP, though it can be changed to MIP/SNIP (as per your configuration and firewall rules). NetScaler sends the trap messages to the configured trap destination and also to the logged-in
/var/ns.log:
The MIBs for SNMP polling can be obtained from the Downloads tab of NetScaler Configuration Utility.
The SNMP OIDs of the vserver, services, or service groups that have been configured on the box can be found under SNMP | SNMP OIDs.
Now let's discuss the Citrix CC—an alternate Citrix solution provided at a much higher level and a Citrix standard for easily managing multiple devices. One can run the CC as a Windows discovery process. How you go about configuring it to automatically discover NetScaler, other Access Gateway and App firewall devices is discussed in the following steps:
Create a map by using name or network address. By creating a blank map, we can add devices to it at any point of time. For that, under the Citrix Network tab, navigate to Maps | Add Name and Description.
Configure NS pool by adding all the VIPs that belong to the NetScaler. This is used when implementing a common config across devices that change SSL certificates or upgrading, and so on. Under Maps, click on Create a Netscaler pool and add required devices to this pool.
The discovery process starts after adding the devices to the map. The discovery works based on hostname or IP address set in the map.
We can view the status of the discovery process in the CC under the Citrix Network tab. Click on the name of the map configured, and under the map, click on the Discovery status.
The NetScaler MPX devices, such as 10500, 12500, and 15500, are rate limited per the license purchased, meaning there is a limit on the number of packets per seconds. SNMP traps can be configured to send a trap message when the threshold is exceeded.
The Monitoring tab of the NetScaler shows the number of connections, the number of TCP Est server connections, resource utilizations, and so on.
The following screenshot shows a sample screen showing the number of connections established for an LB vserver:
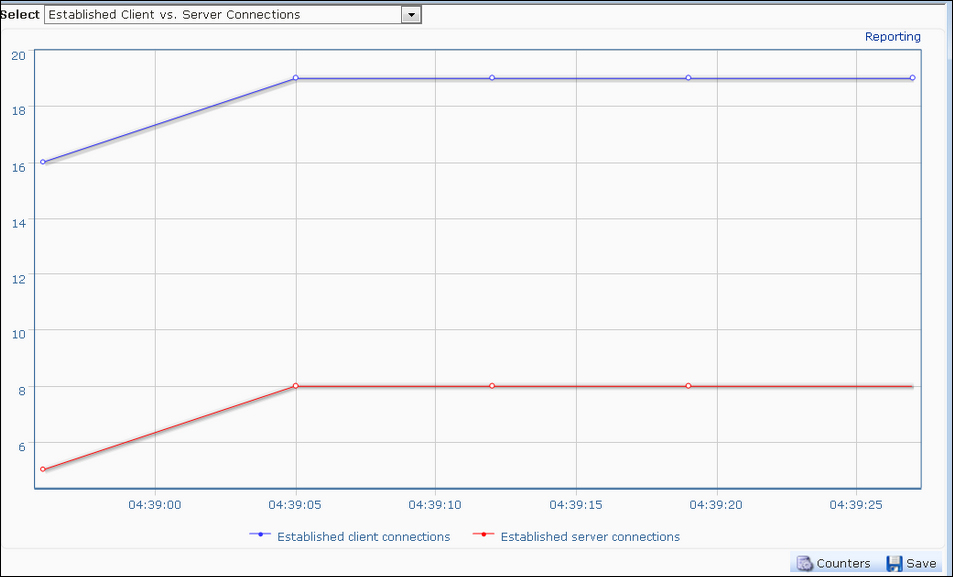
Similarly, CPU and memory utilizations on the device can also be seen on the Monitoring and Reporting pages. The difference between the Monitoring and Reporting pages is that the Monitoring page provides runtime statistics whereas the Reporting page helps collect data for a particular period that can be set to start from the previous hour to the previous year.
The discovery process in the CC is as follows:
After adding the maps with the name and other credentials, the CC sends an SNMP
Getrequest for one of the system OIDs:For CPU utilization:
1.3.6.1.4.1.5951.1.1.0.3For memory utilization:
1.3.6.1.4.1.5951.1.1.0.13
The CC then establishes an SSH connection to these devices with the username credentials provided while adding a map
Once the SSH connection is successful, it will execute a command on the Citrix device to check whether it is a Citrix or a non-Citrix device
The CC will then execute a command to configure the community on the discovered device
Also, the CC will add its own IP address to the list of trap destinations on the Citrix device; thereby receiving all the traps generated by the device
This section will deal with a few tidbits on SNMP and the Citrix CC:
All the seven PDUs of SNMP, namely
GET,GET_NEXT,GET_BULK,INFORM,TRAP, RESPONSE, andSET,can be performed to retrieve data from NetScalerWhenever the CC is configured, please make sure of the connectivity between NetScaler and the CC
It is always recommended not to run the CC in tandem with any other SNMP manager, as it might work incorrectly or not work at all