

We have seen that we can monitor performance from the VCSA command line using vimtop. For a more graphical view, we can log into the VCSA GUI and look at the performance graphs.
To step through this recipe you must have a running VCSA and access to the VCSA web client. No other prerequisites are required.
We will now log in to the VCSA management page to look at its performance:
- Open a web browser and go to
https://<VCSA management IP>:5480. - Log in as the root with the root password.
- Click on
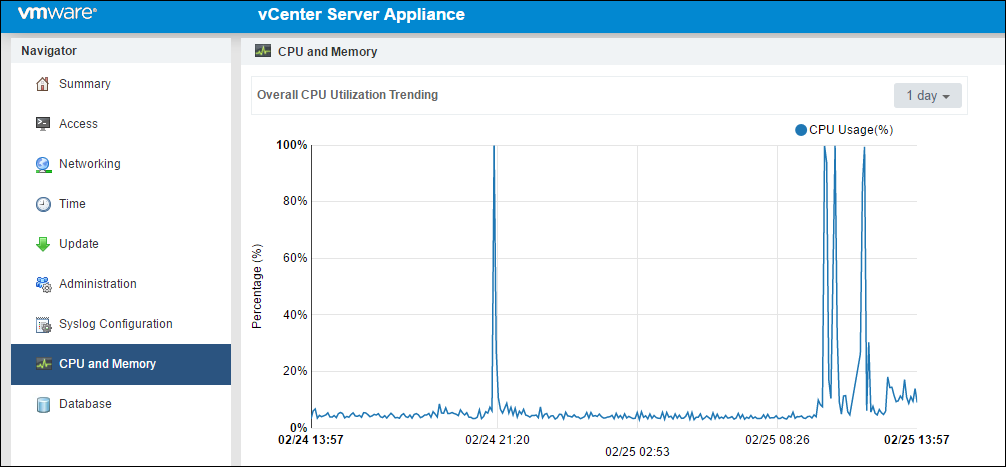
CPU and Memory. - These graphs give a
CPU and Memorygraph based on the intervals of 1 day, 1 week, 1 month, or 1 quarter. The graphs are not customizable but should give you an overview of the performance of your VCSA:
- Now click on the
Databasetab on the left.
This page will show the amount of database usage for Alarms, Events, Tasks, and Stats, as well as the remaining free space:
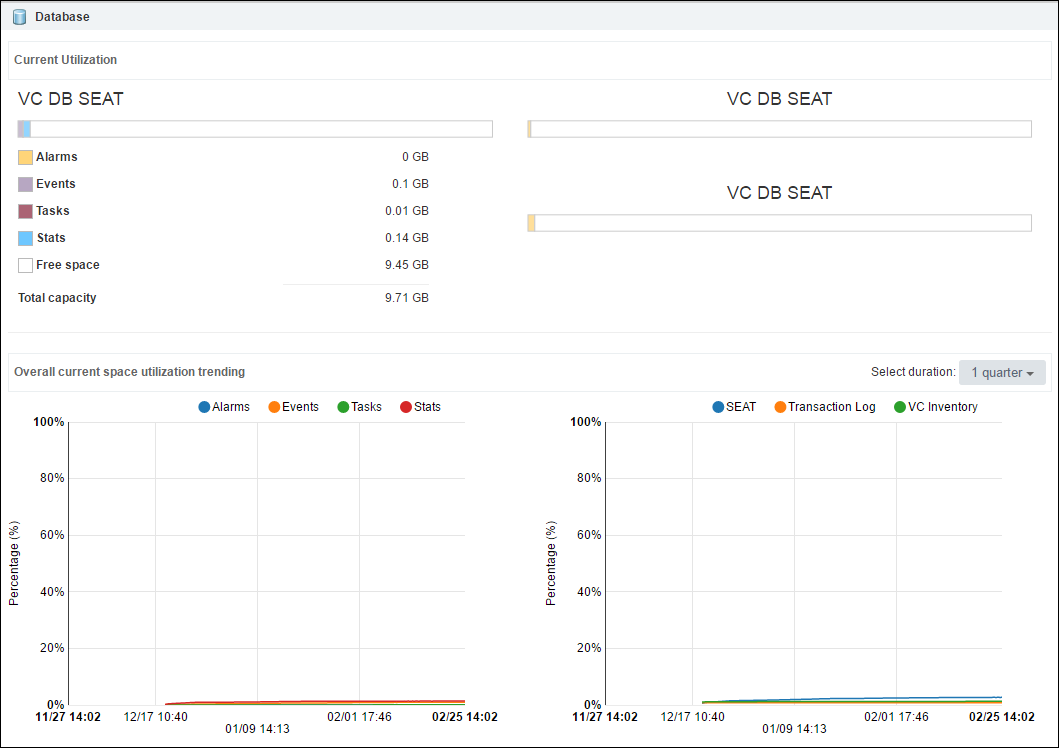
The page also has graphs for estimating when your database...