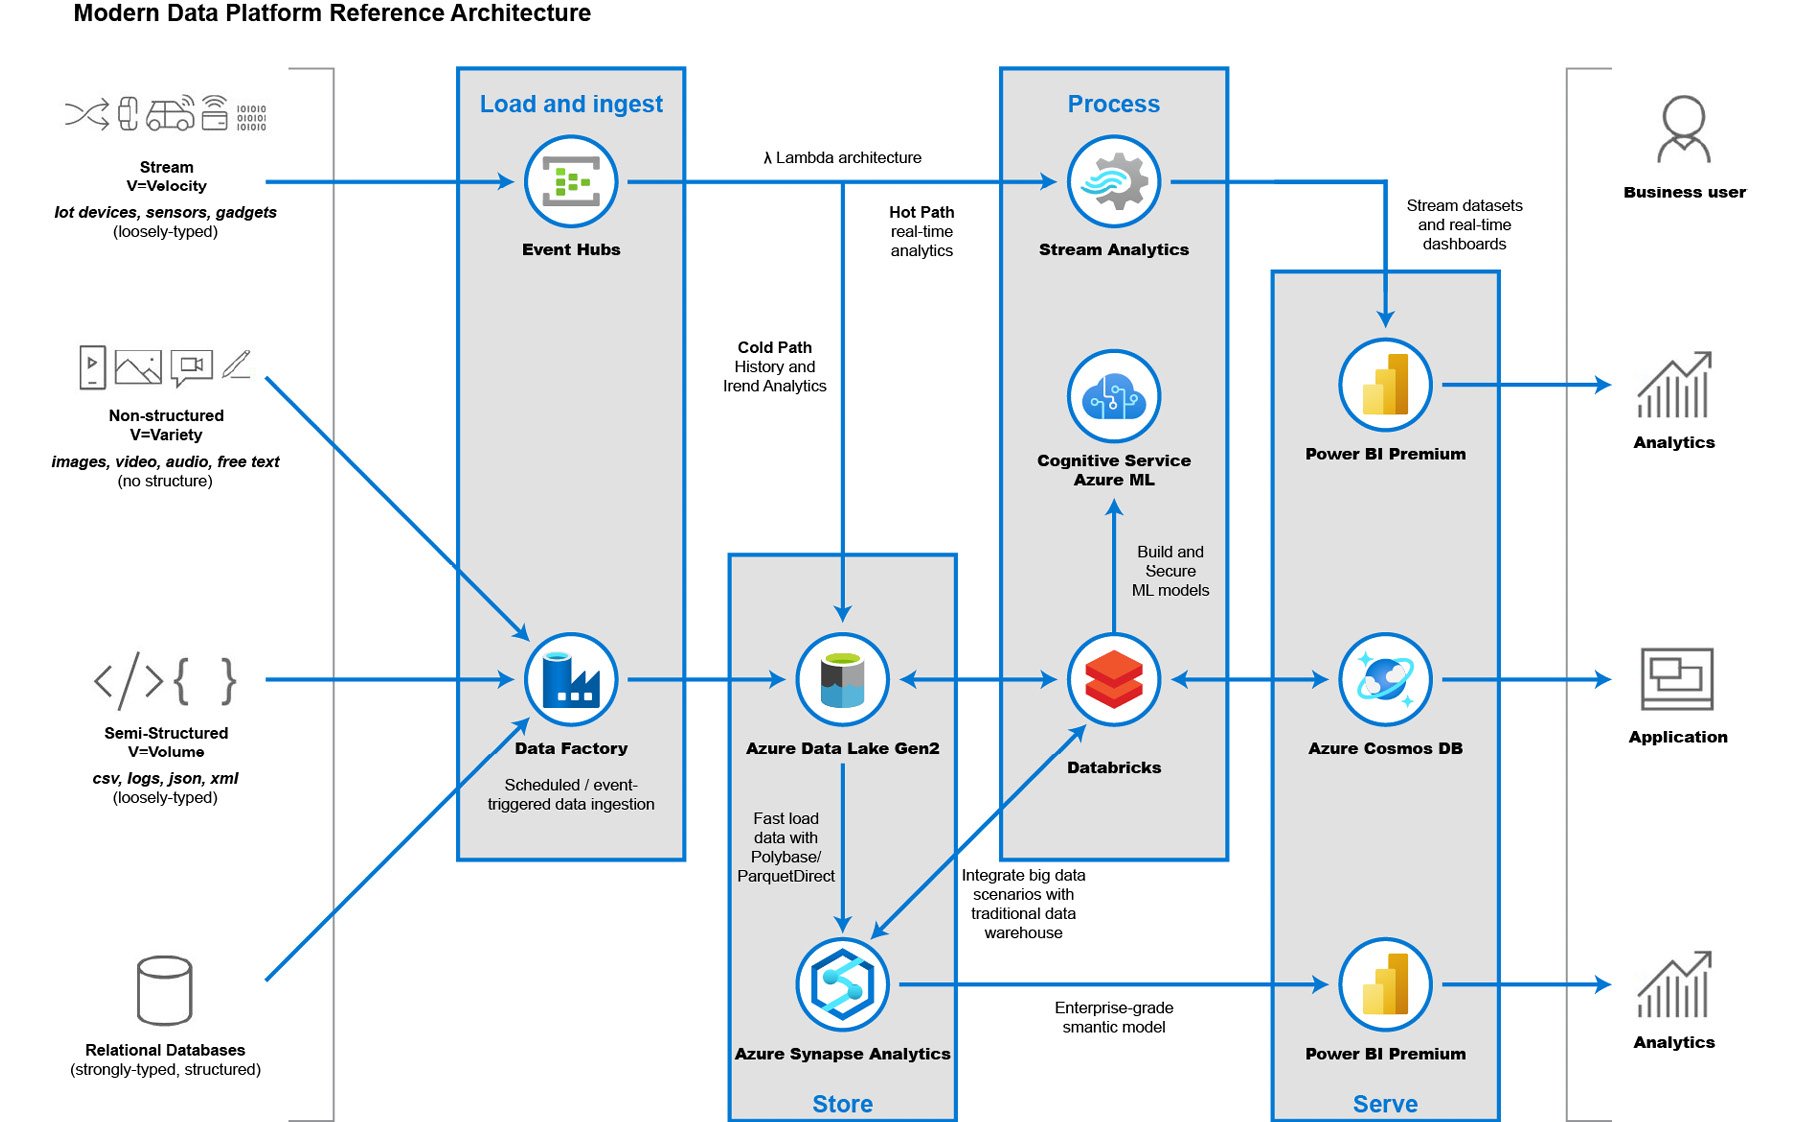
Once you have identified your data sources, the next step is to create a data pipeline (sometimes also referred to as a data flow). At a high level, the steps involved are data ingestion, data storage, data preparation and training, data modeling and serving, and data visualization.
With this approach, you will build a highly scalable architecture that serves all the users of the system: from end users, data engineers and scientists who are doing the data exploration, and analysts who interpret the data for the business, to even the CEO if they want to see what's happening with the business in real-time:
Figure 1.5: Modern data pipeline
Data ingestion
Data ingestion means transferring data (structured, semi-structured, or unstructured) from the source to your storage, data lake, or data warehouse.
This would involve something such as Azure Synapse Analytics using data integration to transfer data from various sources such as on-premises databases and SaaS products to a data lake. This step allows you to manage your ETL and ELT workflows without the need for manual reconciliation.
This is not a one-time process. Ideally, this is something you schedule or set to be triggered so that your data lake gets a historical snapshot from time to time. An example of this is a connection from your CRM tools, such as Microsoft Dynamics CRM, to Azure Data Lake by means of Azure Synapse Analytics with data integration. This will allow data scientists and data engineers to explore this data at different time intervals without interrupting the actual CRM application.
Data storage
Once data has been ingested from various data sources, all the data is stored in a data lake. The data residing within the lake will still be in a raw format and includes both structured and unstructured data formats. At this point, the data won't bring much value to drive business insights.
Data pipeline orchestration and monitoring
In a modern data warehouse scenario, it is very important that data sources and services efficiently transfer data from source to destination. Azure Synapse Analytics with data integration is an orchestrator that allows services to perform data migrations or transfers. It is not the thing performing the actual transfer, but rather instructs a service to perform it—for example, it can tell a Hadoop cluster to perform a Hive query.
Azure Synapse Analytics with data integration also allows you to create alerts and metrics to notify you when the service orchestration is working. You can create an alert via email for when a data transfer from source to destination was not successful.
Data sharing
In a modern data warehouse pattern, sharing data should be both seamless and secure. Often, this can be done via File Transport Protocol (FTP), emails, or APIs, just to name a few. There is a big management overhead if you want to share data at scale. Azure Data Share allows you to securely manage and share your big data to other parties and organizations. The data provider will have full control of who can access the datasets and the permissions each can perform. This makes it easier for dependent companies to derive insights and explore AI scenarios.
Data preparation
Once data is ingested, the next step is data preparation. This is a phase where the data from different data sources is pre-processed for data analytics purposes. An example of this is querying data from an API and inserting them into a database table. Azure Synapse Analytics with data integration allows you to orchestrate this data preparation. Azure Synapse Analytics through a hosted Apache Spark instance can also help with data preparation, as it can run clusters concurrently to process massive amounts of data in just a matter of seconds or minutes.
Data transform, predict, and enrich
Sometimes, data preparation requires further changes beyond a simple copy-and-paste scenario. This is where data transformation comes in. There are instances wherein you want to apply custom logic in the raw data first—applying filters, for instance—before you decide to transfer it to a data warehouse. Azure Synapse Analytics (through data integration), Apache Spark, and SQL Analytics can also help in this scenario. If data in a data lake is not properly transformed into meaningful insights, it will eventually become a data swamp.
Furthermore, you can enrich the batch data at scale by invoking Azure Machine Learning, which makes real-time predictions about data. This can be an added feature in your data pipeline in Azure Synapse Analytics. To learn more about Azure Machine Learning, see Chapter 3, Processing and visualizing data.
Data serve
After preparing and training your data, you'll be ready to model and serve it to the consumers. Basically, in this phase, you are modeling the data to be easily understood by systems. This usually involves performing the complex queries you generated from the data preparation and training phase and inserting these records into a database so that the data is structured in a defined table and schema.
All of your company's analytical data is stored in a data warehouse. You potentially have hundreds to thousands of concurrent users, reports, and dashboards running off a single data warehouse.
You usually perform data modeling and service integrations with a data warehouse platform such as Azure Synapse Analytics. Completing complex queries can take hours or days. But with the power of the cloud, you can scale your Azure Synapse Analytics to perform these queries faster, making days into hours and hours into minutes.
Data visualization
Data visualization is an efficient way of analyzing performance through graphs and charts. This is called business intelligence. Tools such as Power BI help analysts to get the most out of data. Working with Azure, you're not just limited to Power BI, but can also use other visualization services such as Tableau. Data visualization provides a rich and meaningful representation of your data that adds business value for you and your customers. The team can see trends, outliers, and patterns that help in making data-driven decisions.
Various stakeholders within the organization can collaborate after analyzing the different performance parameters. Is your company selling products well? In what regions do you get most of your sales? With rich data backing up your assumptions, business stakeholders, such as CEOs can make reasonable data-driven decisions to minimize risks. What product lines should you expand? Where should you expand further? These are some of the common questions that you can answer once you have richer data analytics.
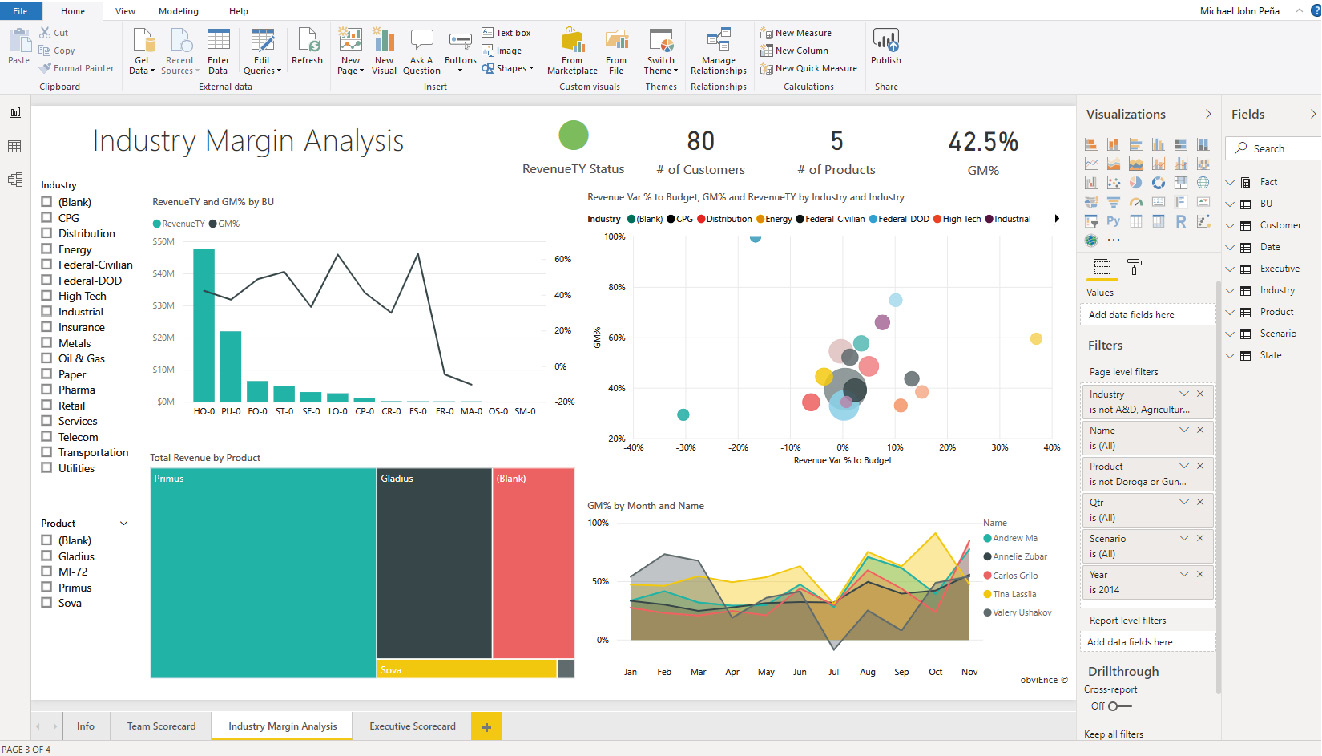
Analysts can use desktop or web application tools to create meaningful representations of their data. Here is an example of a desktop view of Power BI where a user can analyze their company's data and visualize it in graphs:
Figure 1.6: Power BI Desktop-dashboard
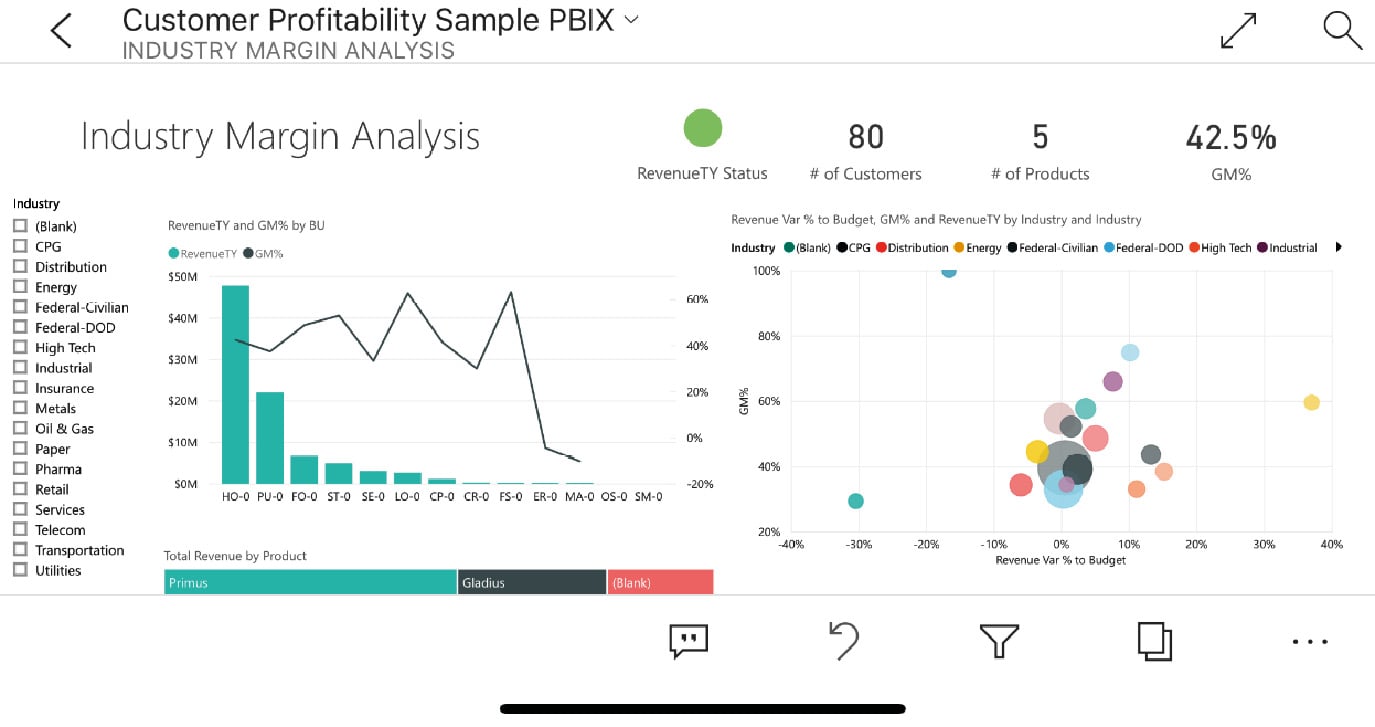
Once the reports are generated, they can be exported to a workspace where people can work together to improve the reports. Here is an example view of the same report in a mobile application. Users can add comments and annotations to the report, allowing a faster feedback loop for analysts:
Figure 1.7: Power BI dashboard for mobile
Power BI allows you to create rich personalized dashboards that best suit your requirements and brand. Compared to having presentations with a snapshot of a graph from last week or last month, this mechanism allows you to refresh the same report over and over again.


 Free Chapter