

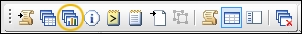
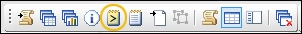
The following screenshot shows the Project Manager toolbar:
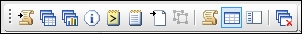
Each of the toolbar buttons shown return to a different section within Minitab.
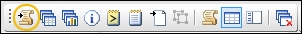
Selecting the session folder returns us to the session window for statistical and graphical output.
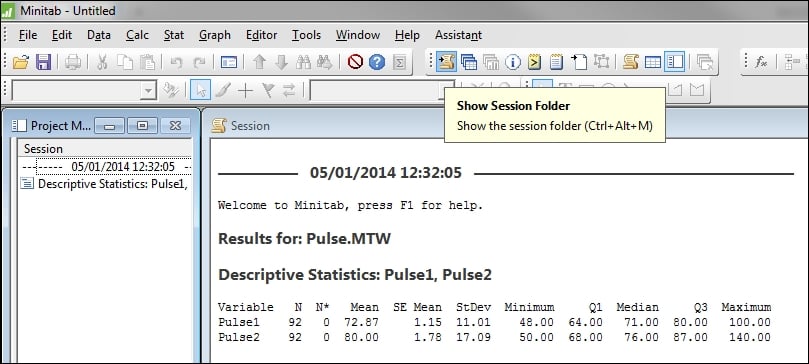
The session window is displayed on the right; the left-hand pane displays the graphs and also the items in the session window. Double-click to select an item to be displayed.
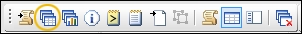
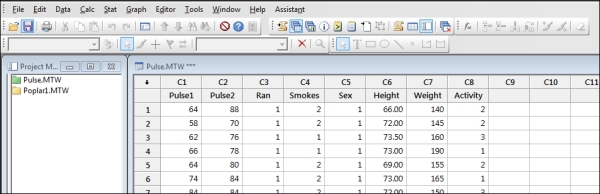
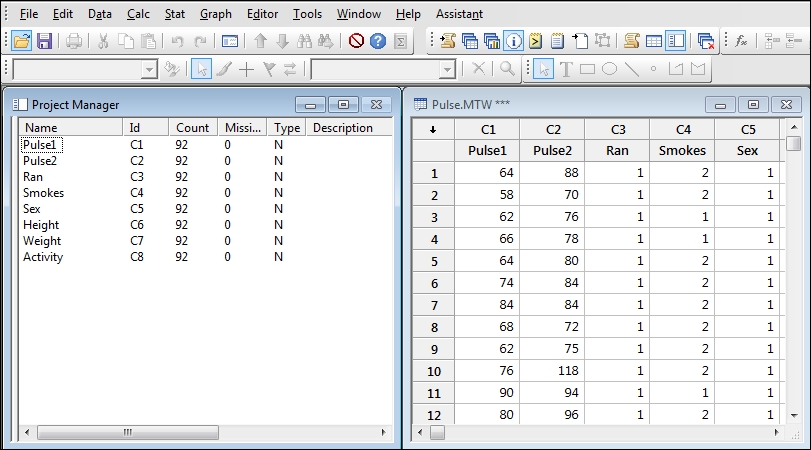
Selecting the worksheet folder returns the worksheets in the project on the left and the active worksheet on the right. The following screenshot displays the two worksheets within the project:
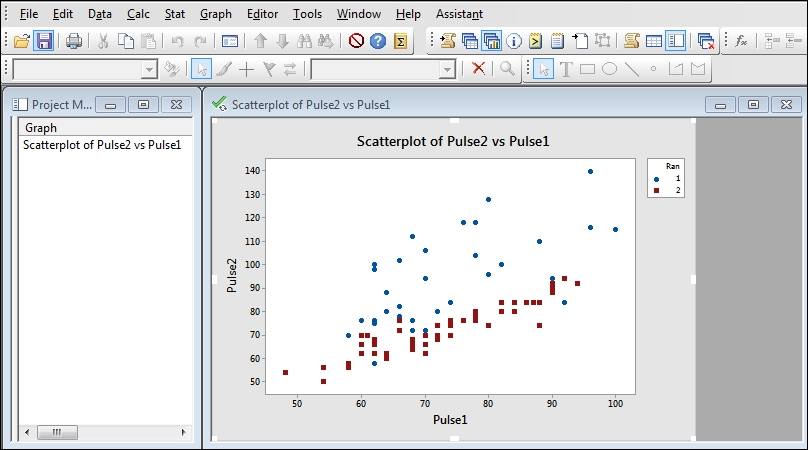
Selecting the graphs folder gives a list of graphs in the project on the left, and the selected graph on the right.
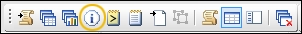
The info window returns information on the columns within the active worksheet. This can be an especially useful place to start when opening a worksheet. While using Minitab, we will often find tools that require columns to be of the same length. The info window can be an important aid in identifying the columns that are missing data.
The history folder displays a list of commands generated from the menus or entered directly into the session or the command-line editor.

Minitab has a large set of default settings that can be adjusted using Options. These are located in the Tools menu and under Options.
It is possible to adjust the default start values in the directories where Minitab will look for datasets, macro directories, and lots more; for example, default graph colors and styles, statistics used within functions such as control charts, and even the type of boxplot that is plotted. Navigate to the locations shown in the following screenshot to adjust some useful settings:
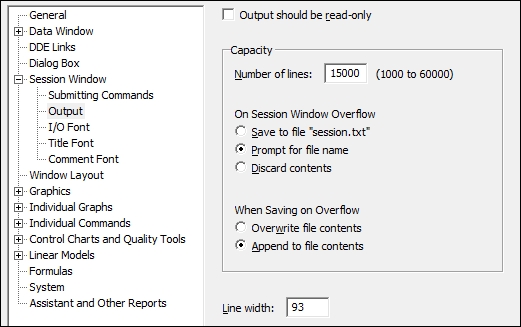
Session Window | Output: The session window's default line width is 93 characters wide in release 17 (79 in release 16). The maximum width is 132 characters. Changing this setting to 132 characters can help large tables fit better into the session window.
Graphics | Annotation | My Footnote: My Footnote controls the information automatically generated as a footnote in the charts. The project and worksheet names, as well as the date and time of the last modification to the charts, can be switched on from here.
Individual Graphs| Boxplots: This allows us to choose between percentiles, hinges, or quartiles to use for boxplots.
Control Charts and Quality Tools| Tests: Here, we can choose the default tests to use for control charts and the values for these tests. Other options within the Control Charts and Quality Tools section allow us to change the methods for estimating standard deviation on control charts.
There are a lot of key presses that can be used within Minitab. This is not an extensive list, just the shortcuts used with this book. More keyboard shortcuts can be found and customized within Minitab from the Tools menu and by selecting Customize.
Ctrl + E: This is used to return to the last dialog box
Ctrl + L: This is used to open the command-line editor
Ctrl + D: This is used to bring the data window to the front
Ctrl + M: This is used to bring the session window to the front
Ctrl + I: This is used to bring the Project Manager to the front
We have tried to use data from many different locations to give a good variety of topics. The following is a list of the locations for these data sets:
The MET office website is used for the Oxford weather station data http://www.metoffice.gov.uk/climate/uk/stationdata/.
The atmospheric pressure difference data is taken from the Climatic Research Unit's website: http://www.cru.uea.ac.uk/data.
The Statistical Science portal provides a useful link to many data sets: http://www.statsci.org/index.html.
UK economy figures can be obtained from the Guardian website: http://www.guardian.co.uk/news/datablog/2009/nov/25/gdp-uk-1948-growth-economy.
The Data and Story Library forms a rich resource for anyone looking for examples: http://lib.stat.cmu.edu/DASL/.