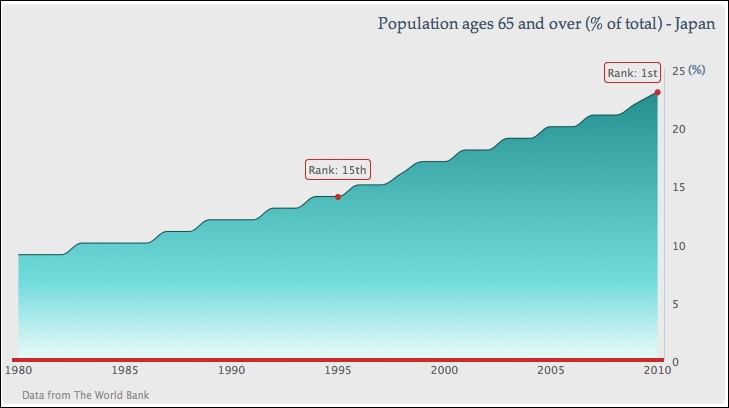
Sketching an area chart
In this section, we are going to use our very first example and turn it into a more stylish graph (based on the design of a wind energy poster by Kristin Clute): an area spline chart. An area spline chart is generated using the combined properties of area and spline charts. The main data line is plotted as a spline curve and the region underneath the line is filled in a similar color with a gradient and opaque style:

First, we want to make the graph easier for viewers to look up the values for the current trend, so we move the y-axis values to the right side of the chart, where they will be closest to the most recent year:
            yAxis: {  ....
                opposite: true
            }
The next thing is to remove the interval lines and have a thin axis line along the y axis:
          yAxis: { ....
              gridLineWidth: 0,
              lineWidth: 1,
          }
Then, we simplify the y-axis title with a percentage sign and align to the top of the axis:
...


