
There are generally two formats that Splunkers will need to categorize to weigh the amount of effort that goes into bringing the data to a dashboard:
Structured data: These are usually logs for Apache, IIS, Windows events, Cisco, and some other manufacturers.
Unstructured data: This type of logging usually comes from a proprietary application where each message can be printed differently in different operations and the event itself can span multiple lines with no definitive event start, or event end, or both. Often, this is the bulk of our data.
In the land of unicorn tears, money trees, and elven magic, IT logs come in the same format, no matter what the platform, and every engineer lives happily ever after.
In our earthly reality, IT logs come in millions of proprietary formats, some structured and others unstructured, waiting to blind the IT engineer with confusion and bewilderment at a moment's notice and suck the very will to continue on their path to problem resolution out of them every day.
As Splunk experts, there are some ways that we can work with our developers in order to ease the process of bringing value to people through machine logs, one of which is to standardize on a log format across platforms. This in effect is creating a structured logging format.
Now when I say "cross-platform" and "standardize", I'm focusing on the in-house platform logs that are within your Splunk indexes and controlled by your in-house development staff right now. We can't affect the way a framework like Java, .NET, Windows, or Cisco log their information, so let's focus on what we can potentially improve. For the rest, we will have to create some Splunk logic to do what's called data normalization. Data normalization is the process of making the field user equal user across your entire first, second, and third-party systems. For instance, in Cisco log files there is a src_ip field. However, in the Juniper world, there is the source_address field. Data normalization is the act of making it so that you can reference a source IP address with a single field name across multiple data sets. In our example lets say source_ip represents both the src_ip field from Cisco, and the source_address from Juniper.
There are a few ways we can standardize on log event formats, and some systems already have these kinds of logging in place. The most Splunk-friendly ways are going to be either key=value pairs, or delimited values, JSON, or XML. I can tell you, through experience, that the easiest way to get Splunk to auto recognize the fields in a log is to use key=value pairs when writing to a log.
Let me give a couple examples of the structured data formats so you at least know what the data looks like:
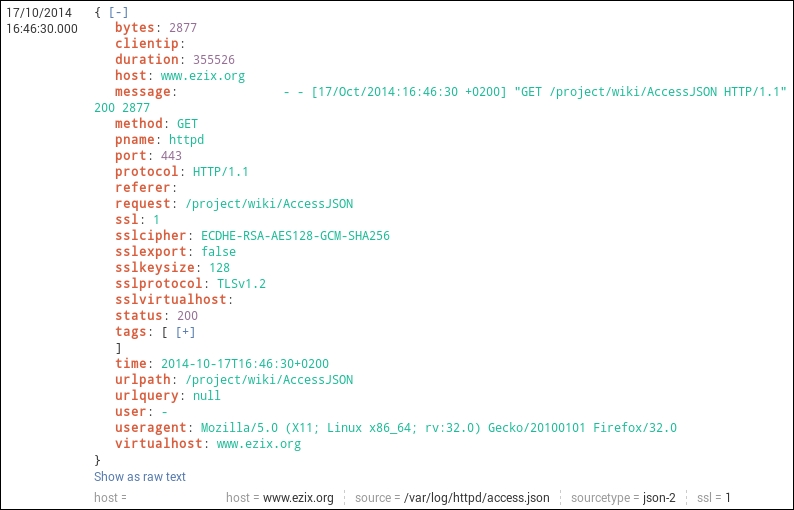
JSON Logging format (this is how Splunk parses JSON logs)
You can find some information about Common Log Format at: https://en.wikipedia.org/wiki/Common_Log_Format .
The following dataset is very easy to parse within Splunk.
127.0.0.1 user-identifier frank [10/Oct/2000:13:55:36 -0700] "GET /apache_pb.gif HTTP/1.0" 200 2326
In this next example, we will learn how:
This is a delimited value format, and for ease we will be looking at web logs.
In the following image, we see that each log event is structured with <value1>, <value2>, and so on. This is a comma delimited log format that Splunk is quite happy with receiving, and pulling information out of:
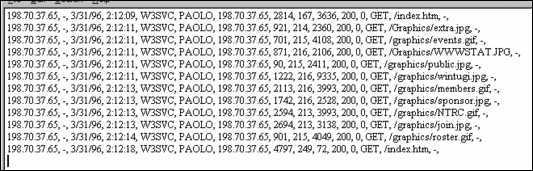
Innately, Splunk will understand the structure of an IIS type of log event. However, in some cases it's up to the Splunk engineer to tell Splunk the field names, and the order of each of these events. This is basically event and field extraction, and it's also how we start organizing and managing the value of a dataset.
In this example there are a couple of ways of extracting knowledge from these events, and I will give both the automatic way and the manual way.
This type of value extraction is performed automatically by the back end Splunk programming. It looks for specific sourcetypes and data structures and extracts fields from them as long as you send data from each forwarder appropriately. For instance, IIS or apache logs.
In order to forward data appropriately, you'll need to:
Tell each forwarder on your IIS/Apache Machines to send data to the following source types (your choice of index):
access_combined - Apache
IIS - IIS
Make sure your Apache/IIS logs have the fields enabled for logging that Splunk is expecting (for more insight on this please see the Splunk documentation https://docs.splunk.com/Documentation .
After that, just run a search for index=<my_index> sourcetype=iis and if your forwarders/indexers are sending and receiving data properly, you should see data and the fields will be extracted in the Interesting Fields panel in Splunk. Voila, you're done!
This IIS/Apache automatic field extraction is available by default in Splunk which makes it nice for these data sets. If your source types are not named in this fashion, the extractions will not work for you out of the box as field extraction happens primarily at the source type level. If you would like to see all of the configuration for the IIS dataset, go to the following locations and look at the stanza:
$PLUNK_HOME/etc/system/default/props.conf-[iis], then take a look at the documentation if you want to learn more about the settings.
IIS data in Splunk should look something like this:
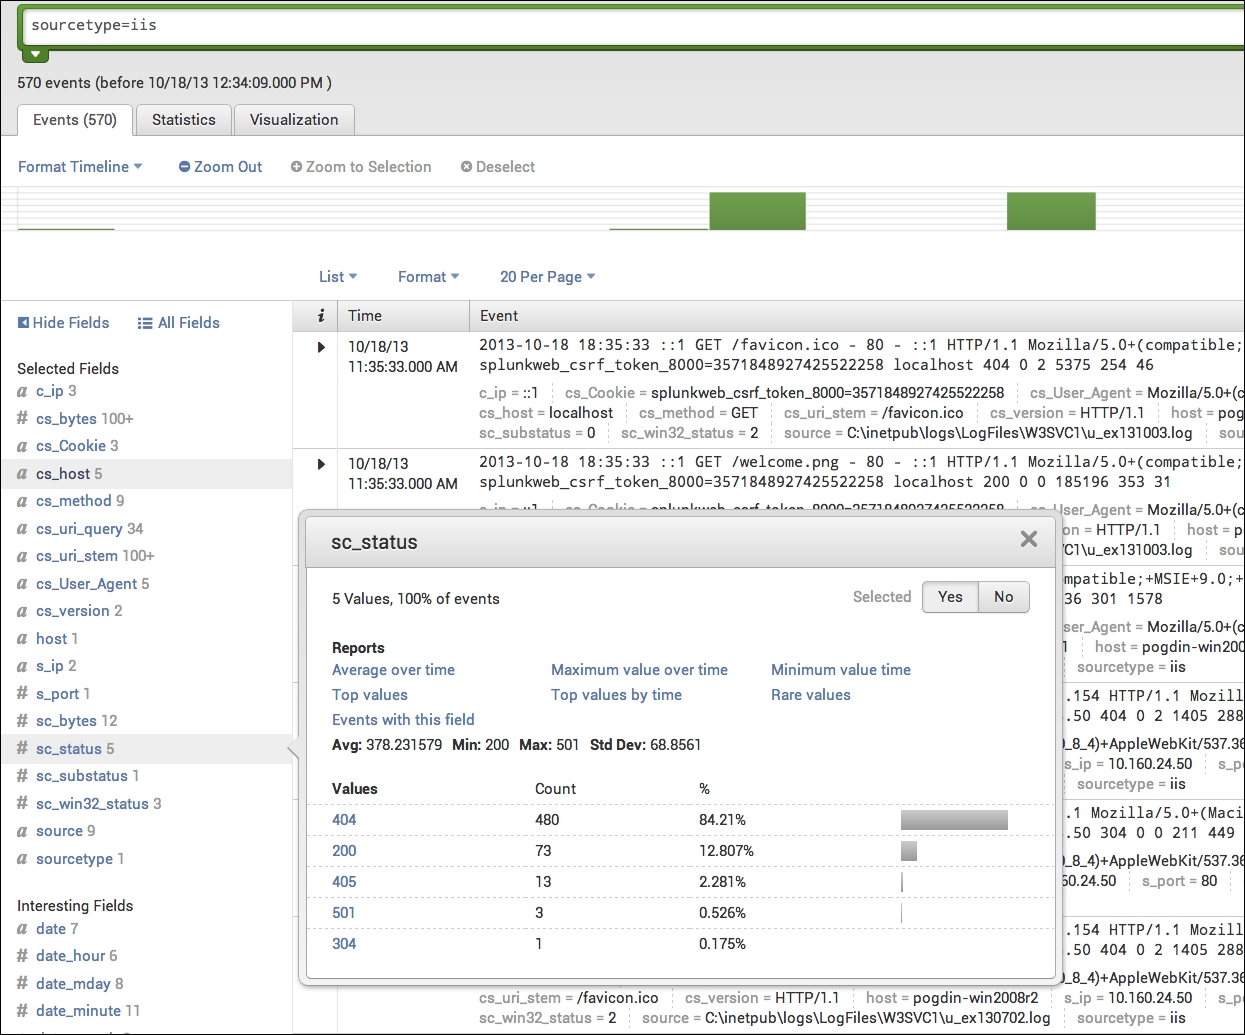
IIS data in Splunk with sc_status
Notice all of the fields that are being extracted under Interesting Fields.
Note
Splunk has only extracted a handful of log types, such as IIS/Apache logs, by default and cannot be leveraged on other datasets. Many of the other datasets are extracted using either an app from Splunkbase or the manual method. For a full list of datasets Splunk has programmed for automatic field extraction, please visit http://www.splunk.com/ . The whole goal of this chapter is to achieve this type of knowledge extraction most efficiently, as all of this is very helpful once we start building searches in Splunk. The most effective way to do this is by literally starting at the log format itself.
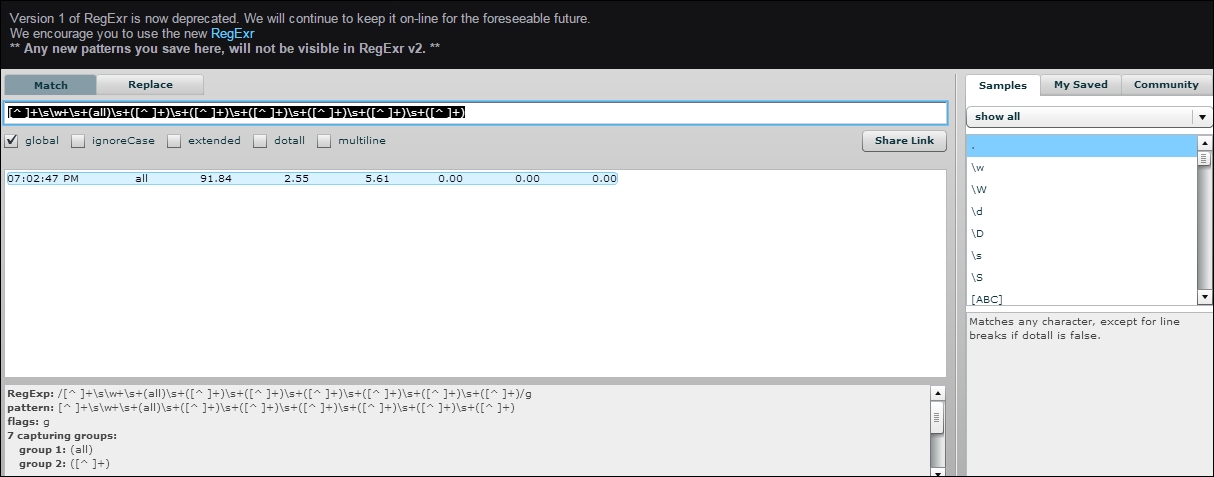
I will not be getting into how to work with REGEX in this book at all. I can only suggest that if you're a Splunk admin and you're not fluent with it... learn it quickly. RegExr ( http://regexr.com/) is a fantastic tool for learning this language or you can also visit https://regex101.com/ . Below is an image of regexr.com/v1 (the old version of the tool):
This technique can be used on any structured log data that is delimited, that Splunk itself doesn't have knowledge extraction of by default.
For this we are going to use the same type of structured data, but let's say that Splunk isn't extracting the data fields, though the data is already being input into Splunk. The data's source is a bash script that was created by a Linux system admin that required specifics on their set of machines.
This is as easy as speaking to the expert whose system the data belongs to.
In this example, the bash scripts output that is coming into Splunk is in a structured but unlabeled format:
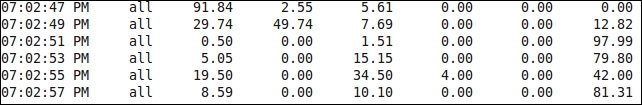
If a general Splunk admin was to look at this data, it would appear to mean something, but it wouldn't be clear as to what. The person who does have clarity is the person who wrote the script. Our job as Splunk experts is often to go find out what this information means. I call this the process of discovery.
We can see a timestamp here, but after that, it's a series of information that makes no sense. The only thing we know for sure is that something is being printed at 2 second intervals and there are multiple values.
When we go to our SME, we need to ask him how he structured the data output that is being printed. Writing that information down will give us the field mappings we are looking for so we can structure this.
When we ask our SME, they will give us an answer that looks like this:
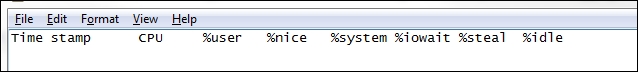
This is our field map, so now all we need to do is tell Splunk how to extract these characters being delimited by a space.
This is a quick and easy prop/transforms.conf setting.
For this example, we will just be using the standard search app, so we are going to adjust the settings there. We will be using REGEX to extract the fields and then standard bash variables to map each REGEX group to its field.
I'm going to add the following stanza to the transforms.conf in $SPLUNK_HOME/etc/apps/search/local/transforms.conf:
[myLinuxScript_fields]
REGEX = [^ ]+\s\w+\s+(all)\s+([^ ]+)\s+([^ ]+)\s+([^ ]+)\s+([^ ]+)\s+([^ ]+)\s+([^ ]+)

FORMAT = cpu::$1 pctUser::$2 pctNice::$3 pctSys::$4 pctIOwait::$5 pctSteal::$6 pctIdle::$7
This REGEX gives Splunk the appropriate capture groups you want to label. These capture groups are signified by the parenthesis in the REGEX above.
I'm also going to call that transform in $SPLUNK_HOME/etc/apps/search/local/props.conf for my source type. We need this reference in order to extract our fields:
[mySourcetype]
REPORT-fields = myLinuxScript_fields
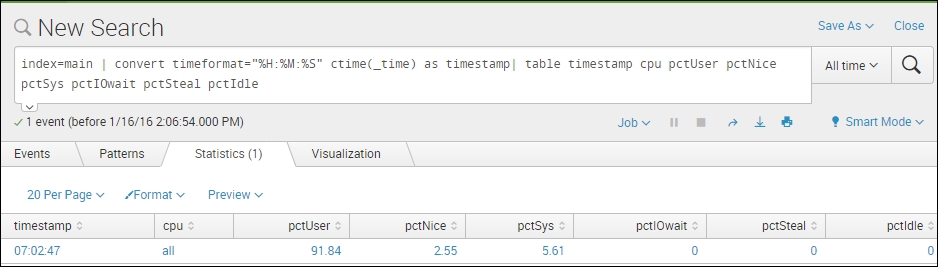
Then we restart the Splunk service on the search head and we should see our new fields.
In the above transform, each REGEX capture group, represented by (), and anything in between them is mapped to a numerical variable. However, the capture groups must be contiguous and sequential. You can't have 10 capture groups and expect $1 to be the 5th group captured. $1 maps to capture group 1, $2 to capture group 2, and so on.
This is the data input from line 1 of the preceding image, with the method explained:
If you're developing an application in the world of structured data and mature logging, there are all kinds of lovely fields that can be used to bring value to our data with Splunk. One of the most valuable fields I've found in the development world that helps Splunk track a transaction end-to-end through a system is a correlation ID.
This is a field that is attached to the initial action of a user on a frontend, and that field value is passed down through the stack from frontend to middleware, to database call and back again during each action or transaction that is committed. This field is usually a uniquely generated GUID that, to Splunk, has huge potential.
Without something like a correlation ID, it's much more difficult to track activities from end-to-end, because many transactions within an application are looked at based on timestamp when troubleshooting. This little field will make your life profoundly easier if used properly with Splunk.
Some systems already have correlation IDs, such as SharePoint logging. However, many do not. If you're a developer of middleware and you're reading this, please use this field, as it makes mining for your data a lot easier.
This is an example of a SharePoint log with a correlation ID:
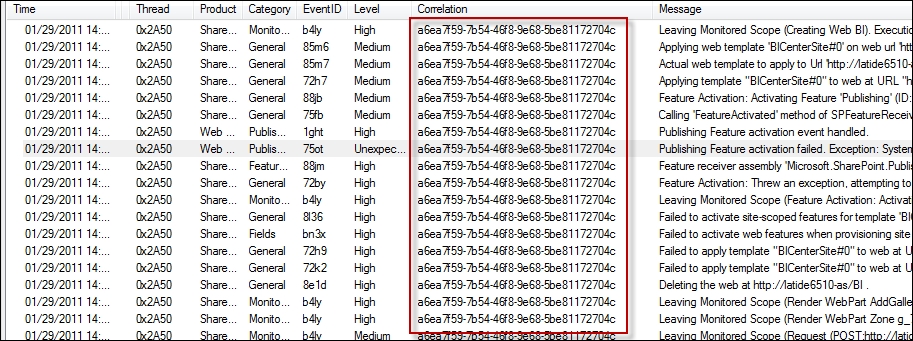
SharePoint log with a correlation ID
As you can see, this correlation ID is used throughout all log events made during this user's session. This allows great event correlation within a system.
For those who aren't familiar, there is a challenge within development with correlation IDs and specifically it's based on; when do we use them? Do we use them for everything? The answer to these questions usually boils down to the type of transaction being made within a system. I will share with you some techniques I've found to be useful, and have brought the most value to Splunk when working on development.
First we need to understand our three most popular actions within an application:
Publication: This is when an application answers a query and publishes data to a user one time. A user clicks a button, the application serves the user it's data for that request, and the transaction is complete.
Subscription: This is a transaction that begins with the click of a button, though the data streams to the user until something stops it. Think of this kind of transaction as a YouTube video that you click on. You click to start the video, and then it just streams to your device. The stream is a subscription type of transaction. While the application is serving up this data, it is also often writing to the application logs. This can get noisy as subscriptions can sometimes last hours or even days.
Database call: These are simply calls to a database to either retrieve or insert data to a database. These actions are usually pretty easy to capture. It's what people want to see from this data that becomes a challenge.
It's very simple. Add correlation IDs to all of your publication transactions, and save yourself and your ops team hundreds of hours of troubleshooting.
When writing to a log, if we can log a correlation ID for each publication transaction and insert that data into Splunk, then we can increase the view of what our application is doing tremendously. I will refer to SharePoint again as it is the easiest and most well-known to reference:

In the preceding image, all of these events are publications and you can see that it's even written into the log message itself in some events. What we are looking at above is a slice of time a user has been on our system, and their activity.
If we put this data into Splunk, and we extract the correlation ID field correctly, it's as easy as finding a single event with a username and then copying and pasting the correlation ID into our search query to find our user's entire behavior. Above, we are looking at a single instance of SharePoint.
In the real world we may have:
200 users
10 user-facing machines running an application that is load-balanced
30 middleware machines
4 databases
100+ tables.
Following a single user's activity through that system becomes time consuming, but if we use correlation IDs, mixed with Splunk, we will find ourselves saving days of time when looking for problems. We can also proactively alert on our system if we extract the knowledge in Splunk properly.
Developers actually love correlation IDs more than operations, because inserting their application data into Splunk and allowing them a single place to search the logs of their applications where all they have to do is find the correlation ID to look for a user's activity saves lots of time in QA.
The most common question for subscription transactions and correlation IDs is; How can we minimize the wasted space in the log that arises from subscription events, seeing as they are part of the same transaction and don't need to be written to every event within each subscription?
For subscription type events within a log, they are commonly very noisy and not needed until something breaks.
The compromise for writing correlation IDs to let Splunk continue to monitor user activity is to write a correlation ID in the event only at subscription start and subscription end.
If you want further detail on your subscriptions, and you want Splunk to be able to quickly retrieve these events, the developers I've known have used subscription IDs, which are printed to the log with every action within a subscription transaction. These are also usually GUIDs, but they target only a user's subscription within your system.
This often ends up being seen most in Splunk license utilization. However, if we plan accordingly, we can subvert this issue in the real world.
In this type of transaction we can write a correlation ID each time a transaction occurs, the same way we would do as a publication. As best practice, write this ID to the log event in the same manner one would on a publication transaction.
The larger the system, the more chaos we as Splunk experts must try to bring some order to. In many cases, companies have a specific use case for something like Splunk, though they often expect that Splunk is a turnkey solution.