Book Image

Splunk Best Practices

Book Image

Splunk Best Practices

Overview of this book

This book will give you an edge over others through insights that will help you in day-to-day instances. When you're working with data from various sources in Splunk and performing analysis on this data, it can be a bit tricky. With this book, you will learn the best practices of working with Splunk. You'll learn about tools and techniques that will ease your life with Splunk, and will ultimately save you time. In some cases, it will adjust your thinking of what Splunk is, and what it can and cannot do. To start with, you'll get to know the best practices to get data into Splunk, analyze data, and package apps for distribution. Next, you'll discover the best practices in logging, operations, knowledge management, searching, and reporting. To finish off, we will teach you how to troubleshoot Splunk searches, as well as deployment, testing, and development with Splunk.
Table of Contents (16 chapters)

Data model/pivot referenced panels


A data model is a fantastic way to speed up dashboards, and it can handle some very complex data and make it understandable. The Pivot function relies on a data model in order to generate the visualization. If at all possible, these are the ways to build dashboards in order to pull lots of data to the surface of Splunk efficiently.

I will skip the best practices of data model creation; you should refer to the following link if you want to know how to create a data model: http://docs.splunk.com/Documentation/Splunk/latest/PivotTutorial/WelcometothePivotTutorial .

Once our data model is created, we can very easily reference it within our dashboards through pivots and save those pivot charts as panels.

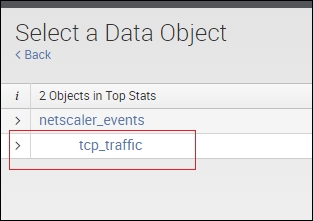
To do so, go the data model itself and click on the tcp constraint for your data model, as shown in the following screenshot:

When you select this object, make sure you click the pie icon on the bottom left, as shown in the next screenshot:

And select the time...