-
Book Overview & Buying
-
Table Of Contents

Learning Jupyter
By :
Learning Jupyter
By:
Overview of this book
Jupyter Notebook is a web-based environment that enables interactive computing in notebook documents. It allows you to create and share documents that contain live code, equations, visualizations, and explanatory text. The Jupyter Notebook system is extensively used in domains such as data cleaning and transformation, numerical simulation, statistical modeling, machine learning, and much more.
This book starts with a detailed overview of the Jupyter Notebook system and its installation in different environments. Next we’ll help you will learn to integrate Jupyter system with different programming languages such as R, Python, JavaScript, and Julia and explore the various versions and packages that are compatible with the Notebook system. Moving ahead, you master interactive widgets, namespaces, and working with Jupyter in a multiuser mode.
Towards the end, you will use Jupyter with a big data set and will apply all the functionalities learned throughout the book.
Table of Contents (11 chapters)
Preface

 Free Chapter
1. Introduction to Jupyter
2. Jupyter Python Scripting
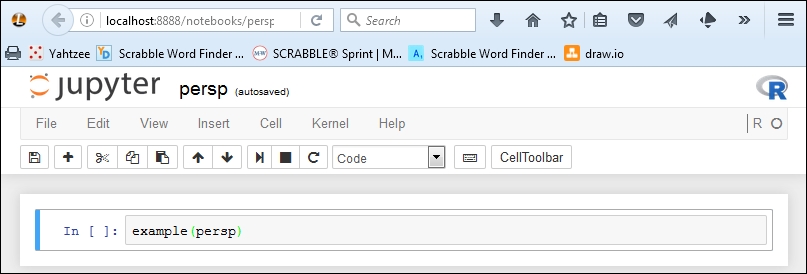
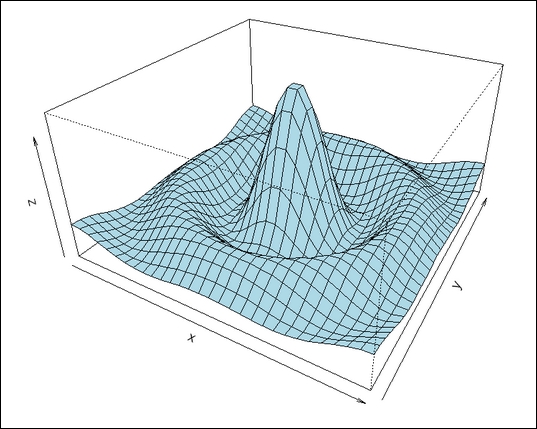
3. Jupyter R Scripting
4. Jupyter Julia Scripting
5. Jupyter JavaScript Coding
6. Interactive Widgets
7. Sharing and Converting Jupyter Notebooks
8. Multiuser Jupyter Notebooks
9. Jupyter Scala