Book Image

Mastering Predictive Analytics with R - Second Edition

By : James D. Miller, Rui Miguel Forte
Book Image

Mastering Predictive Analytics with R - Second Edition

By: James D. Miller, Rui Miguel Forte

Overview of this book

R offers a free and open source environment that is perfect for both learning and deploying predictive modeling solutions. With its constantly growing community and plethora of packages, R offers the functionality to deal with a truly vast array of problems. The book begins with a dedicated chapter on the language of models and the predictive modeling process. You will understand the learning curve and the process of tidying data. Each subsequent chapter tackles a particular type of model, such as neural networks, and focuses on the three important questions of how the model works, how to use R to train it, and how to measure and assess its performance using real-world datasets. How do you train models that can handle really large datasets? This book will also show you just that. Finally, you will tackle the really important topic of deep learning by implementing applications on word embedding and recurrent neural networks. By the end of this book, you will have explored and tested the most popular modeling techniques in use on real- world datasets and mastered a diverse range of techniques in predictive analytics using R.
Table of Contents (22 chapters)
Mastering Predictive Analytics with R Second Edition
Credits
About the Authors
About the Reviewer
www.PacktPub.com
Customer Feedback
Preface
8
Dimensionality Reduction
Index

Classifying with linear regression


Even though we know classification problems involve qualitative outputs, it seems natural to ask whether we could use our existing knowledge of linear regression and apply it to the classification setting. We could do this by training a linear regression model to predict a value in the interval [0, 1], remembering that we've chosen to label our two classes as 0 and 1. Then, we could apply a threshold to the output of our model in such a way that, if the model outputs a value below 0.5, we would predict class 0; otherwise, we would predict class 1.

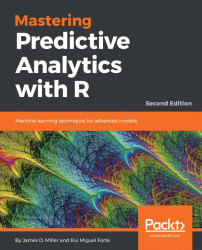
The following graph demonstrates this concept for a simple linear regression with a single input feature X1 and for a binary classification problem.

Our output variable y is either 0 or 1, so all the data lies on two horizontal lines. The solid line shows the output of the model, and the dashed line shows the decision boundary, which arises when we put a threshold on the model's predicted output at the value 0...