

In time series, we typically use univariate data. That is, we use a single series to predict its future values. Let's say that we are studying Google's stock price data, and we are asked to forecast the future values of stock prices. In this case, we will need historic data of Google's stock prices. Based on that, we will make predictions.
However, at times, we need multiple time series to make a forecast. But why is it that we need multiple time series? Any guesses?
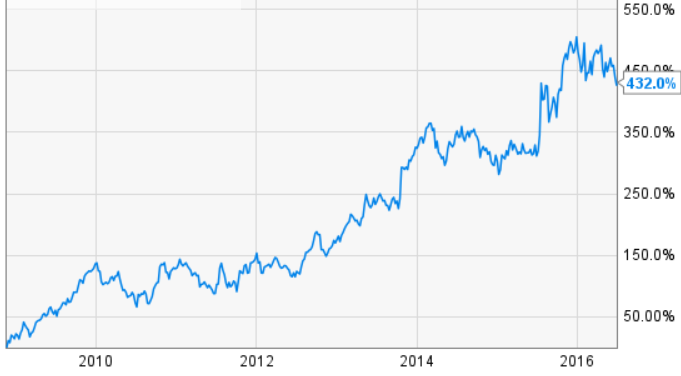
The following graph shows Google's stock price data:
The answer is that we need to understand and explore the relationship between multiple time series as this can improve our forecast. For example, we have got correlated time series of GDP Deflator: Services and WPI: All Commodities, as follows:
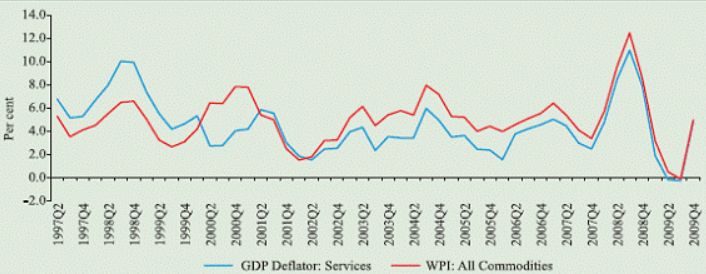
It is quite evident that these two seem to carry a relationship. When we have to forecast GDP Deflator: Services, we can use WPI: All Commodities time series data as input. This is called Granger causality.
To put it more...