Book Image

Learning Tableau 2019 - Third Edition

By : Joshua N. Milligan
Book Image

Learning Tableau 2019 - Third Edition

By: Joshua N. Milligan

Overview of this book

Tableau is the gold standard of business intelligence and visual analytics tools in every industry. It enables rapid data visualization and interpretation with charts, graphs, dashboards, and much more. Updated with the latest features of Tableau, this book takes you from the foundations of the Tableau 2019 paradigm through to advanced topics. This third edition of the bestselling guide by Tableau Zen Master, Joshua Milligan, will help you come to grips with updated features, such as set actions and transparent views. Beginning with installation, you'll create your first visualizations with Tableau and then explore practical examples and advanced techniques. You'll create bar charts, tree maps, scatterplots, time series, and a variety of other visualizations. Next, you'll discover techniques to overcome challenges presented by data structure and quality and engage in effective data storytelling and decision making with business critical information. Finally, you'll be introduced to Tableau Prep, and learn how to use it to integrate and shape data for analysis. By the end of this book, you will be equipped to leverage the powerful features of Tableau 2019 for decision making.
Table of Contents (18 chapters)
Free Chapter
1
Section 1: Tableau Foundations
5
Section 2: Leveraging the Full Power of Tableau
10
Digging Deeper - Trends, Clustering, Distributions, and Forecasting
11
Section 3: Data Prep and Structuring
14
Section 4: Advanced Techniques and Sharing with Others

Transparency

In newer versions of Tableau, you may set transparency for visualizations used on dashboards. This enables all kinds of innovative approaches, such as layering visualizations on top of each other or over background images.

You'll find the following example in the Chapter 11 Complete workbook:

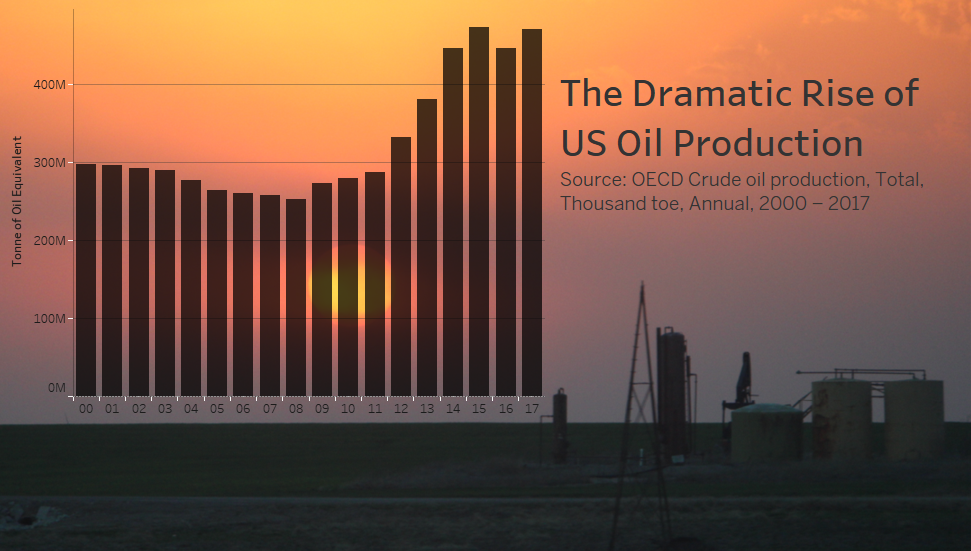
The dashboard consists of an image, a transparent chart over the image, and a title.

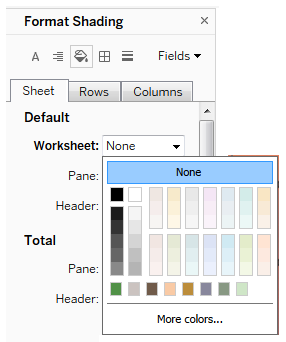
To make a visualization transparent, go to Format Shading and set the Worksheet shading to None:

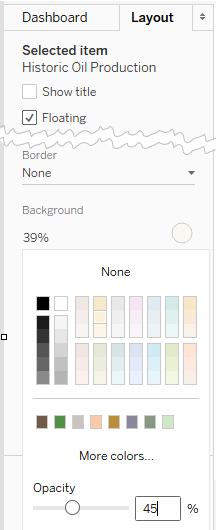
Once you have set the shading to None, the visualization will be transparent when used on a dashboard. At this point, you can also achieve a semi-transparent effect by selecting the visualization on the dashboard, switching to the Layout tab, and adjusting the background to have a color with Opacity:

Be careful that your use of transparency does not detract from the data story. Background...