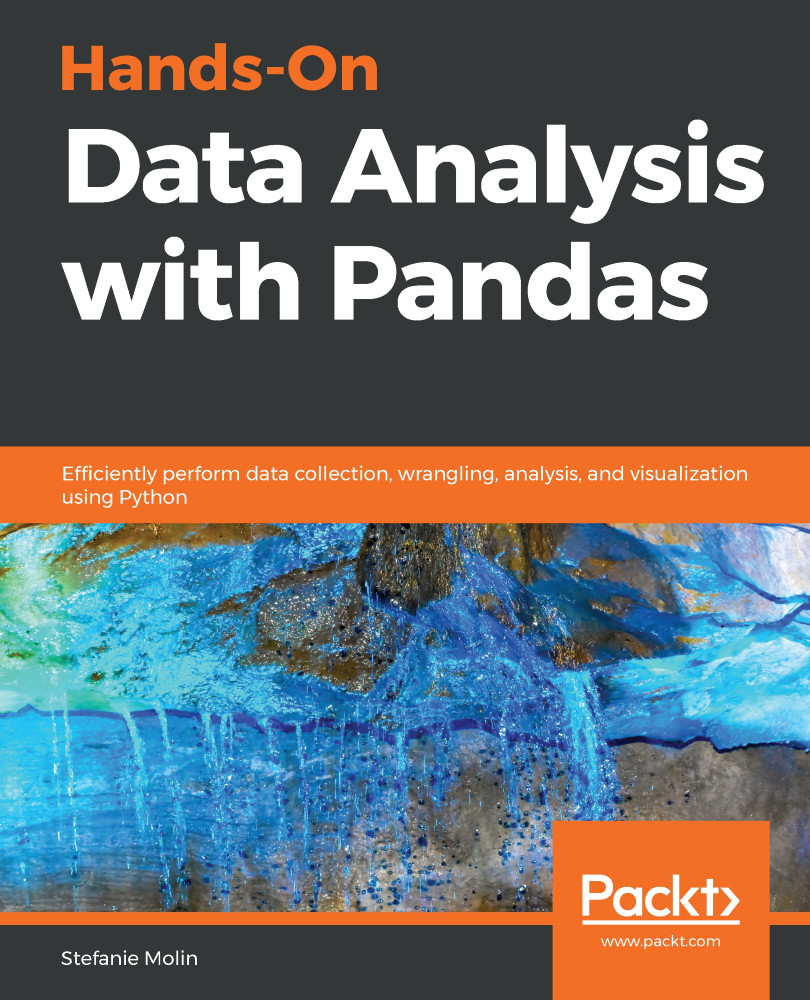
Book Image

Hands-On Data Analysis with Pandas

By : Stefanie Molin
Book Image

Hands-On Data Analysis with Pandas

By: Stefanie Molin

Overview of this book

Data analysis has become a necessary skill in a variety of domains where knowing how to work with data and extract insights can generate significant value. Hands-On Data Analysis with Pandas will show you how to analyze your data, get started with machine learning, and work effectively with Python libraries often used for data science, such as pandas, NumPy, matplotlib, seaborn, and scikit-learn. Using real-world datasets, you will learn how to use the powerful pandas library to perform data wrangling to reshape, clean, and aggregate your data. Then, you will be able to conduct exploratory data analysis by calculating summary statistics and visualizing the data to find patterns. In the concluding chapters, you will explore some applications of anomaly detection, regression, clustering, and classification using scikit-learn to make predictions based on past data. By the end of this book, you will be equipped with the skills you need to use pandas to ensure the veracity of your data, visualize it for effective decision-making, and reliably reproduce analyses across multiple datasets.
Table of Contents (21 chapters)
Free Chapter
1
Section 1: Getting Started with Pandas
4
Section 2: Using Pandas for Data Analysis
9
Section 3: Applications - Real-World Analyses Using Pandas
12
Section 4: Introduction to Machine Learning with Scikit-Learn
16
Section 5: Additional Resources
18
Solutions

The Road Ahead

Throughout this book, we have covered a lot of material, and you are now capable of performing data analysis and machine learning tasks entirely in Python. We began our journey by learning about some introductory statistics and how to set up our environment for data science in Python. Then, we learned about the basics of using pandas and how to bring data into Python. With this knowledge, we were able to work with APIs, read from files, and query databases to grab data for our analyses.

After we collected our data, we learned how to perform data wrangling in order to clean up our data and get it into a usable format. Next, we learned how to work with time series and combine data from different sources, as well as aggregate it. Once we had a good handle on data wrangling, we moved on to visualizations and used pandas, matplotlib, and seaborn to create a variety...