Book Image

Machine Learning with the Elastic Stack - Second Edition

By : Rich Collier, Camilla Montonen, Bahaaldine Azarmi
5 (1)
Book Image

Machine Learning with the Elastic Stack - Second Edition

5 (1)
By: Rich Collier, Camilla Montonen, Bahaaldine Azarmi

Overview of this book

Elastic Stack, previously known as the ELK stack, is a log analysis solution that helps users ingest, process, and analyze search data effectively. With the addition of machine learning, a key commercial feature, the Elastic Stack makes this process even more efficient. This updated second edition of Machine Learning with the Elastic Stack provides a comprehensive overview of Elastic Stack's machine learning features for both time series data analysis as well as for classification, regression, and outlier detection. 
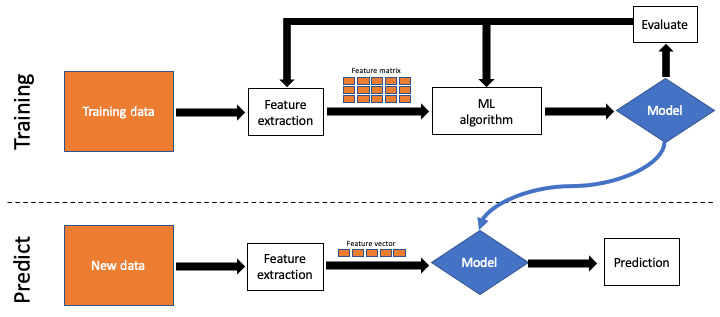
The book starts by explaining machine learning concepts in an intuitive way. You'll then perform time series analysis on different types of data, such as log files, network flows, application metrics, and financial data. As you progress through the chapters, you'll deploy machine learning within Elastic Stack for logging, security, and metrics. Finally, you'll discover how data frame analysis opens up a whole new set of use cases that machine learning can help you with. By the end of this Elastic Stack book, you'll have hands-on machine learning and Elastic Stack experience, along with the knowledge you need to incorporate machine learning in your distributed search and data analysis platform.
Table of Contents (19 chapters)
1
Section 1 – Getting Started with Machine Learning with Elastic Stack
4
Section 2 – Time Series Analysis – Anomaly Detection and Forecasting
11
Section 3 – Data Frame Analysis

Applying supervised ML to data frame analytics

With the exception of outlier detection (covered in Chapter 10, Outlier Detection which actually is an unsupervised approach, the rest of data frame analytics uses a supervised approach. Specifically, there are two main types of problems that Elastic ML data frame analytics allows you to address:

  • Regression: Used to predict a continuous numerical value (a price, a duration, a temperature, and so on)
  • Classification: Used to predict whether something is of a certain class label (fraudulent transaction versus non-fraudulent, and more)

In both cases, models are built using training data to map input variables (which can be numerical or categorical) to output predictions by training decision trees. The particular implementation used by Elastic ML is a custom variant of XGBoost, an open source gradient-boosted decision tree framework that has recently gained some notoriety among data scientists for its ability to allow them to win Kaggle competitions.

The process of supervised learning

The overall process of supervised ML is very different from the unsupervised approach. In the supervised approach, you distinctly separate the training stage from the predicting stage. A very simplified version of the process looks like the following:

Figure 1.9 – Supervised ML process

Figure 1.9 – Supervised ML process

Here, we can see that in the training phase, features are extracted out of the raw training data to create a feature matrix (also called a data frame) to feed to the ML algorithm and create the model. The model can be validated against portions of the data to see how well it did, and subsequent refinement steps could be made to adjust which features are extracted, or to refine the parameters of the ML algorithm used to improve the accuracy of the model's predictions.

Once the user decides that the model is efficacious, that model is "moved" to the prediction workflow, where it is used on new data. One at a time, a single new feature vector is inferenced against the model to form a prediction.

To get an intuitive sense of how this works, imagine a scenario in which you want to sell your house, but don't know what price to list it for. You research prior sales in your area and notice the price differentials for homes based on different factors (number of bedrooms, number of bathrooms, square footage, proximity to schools/shopping, age of home, and so on). Those factors are the "features" that are considered altogether (not individually) for every prior sale.

This corpus of historical sales is your training data. It is helpful because you know for certain how much each property sold for (and that's the thing you'd ultimately like to predict for your house). If you study this enough, you might get an intuition about how the prices of houses are driven strongly by some features (for instance, the number of bedrooms) and that other features (perhaps the age of the home) may not affect the pricing much. This is a concept called "feature importance" that will be visited again in a later chapter.

Armed with enough training data, you might have a good idea what the value of your home should be priced at, given that it is a three-bedroom, two-bath, 1,700-square-foot, 30-year-old home. In other words, you've constructed a model in your mind based on your research of comparable homes that have sold in the last year or so. If the past sales are the "training data," your home's specifications (bedrooms, bathrooms, and so on) are the feature vectors that will define the expected price, given your "model" that you've learned.

Your simple mental model is obviously not as rigorous as one that could be constructed with regression analysis using ML using dozens of relevant input features, but this simple analogy hopefully cements the idea of the process that is followed in learning from prior, known situations, and then applying that knowledge to a present, novel situation.