The fundamentals of nodes and edges and the properties of a graph
Graphs, or networks, are particularly powerful data structures for modeling and describing relationships between things, whether these things are people, products, or machines. In a graph, those things that we coined earlier are represented by nodes (sometimes known as vertices). Nodes are connected by edges (sometimes referred to as relationships). In a network, an edge represents a relationship between two things, indicating that, somehow, they are linked.
The following sections will look at the structures and types of graphs. First, we will start with undirected graphs before moving on to directed graphs. After that, we will look at node properties, then delve into heterogeneous graphs, and end by looking at schema design considerations.
Undirected graphs
To illustrate, a simple example is that of a real-life social network. In the following example, Jeremy and Mark are each represented by a node. Jeremy is friends with Mark, and the friend relationship is represented by an edge connecting the two nodes. The following diagram shows an undirected graph:

Figure 1.1 – Two friend nodes are linked together with a single edge
However, not all social networks are the same, and in some online social media platforms, relationships between users of a social network may not be mutual.
For example, on Twitter, one user can follow another, but this doesn’t mean the inverse must be true. On Twitter, Jeremy may follow Mark, but Mark may not follow Jeremy.
Directed graphs
Here, a directional edge is used to show that Jeremy follows Mark, while the absence of an edge in the reverse direction shows that Mark does not follow Jeremy in return:

Figure 1.2 – Two friend nodes are linked together with a single edge
This type of graph is known as a directed graph. For reference, sometimes, undirected edges like those in Figure 1.1 are shown as bidirectional edges, pointing to both nodes. This bidirectional representation is equivalent to an undirected edge in most senses and represents a mutual relationship.
Importantly, when creating a data model with directional edges, naming relationships appropriately becomes important. In our Twitter example, if the edge representing the interaction between Mark and Jeremy is follows, then the edge goes from the Jeremy node to the Mark node.
On the other hand, if the edge represents a concept such as followed by, then this should be in the other direction – that is, from Mark to Jeremy. This has particularly strong implications for some more complex graph modeling and use cases, which we will cover in Chapter 2, Working with Graph Data Models.
Node properties
While nodes and edges (directional or not) are the basic building blocks of a graph, they are often not sufficient to fully describe a dataset. Nodes can have data associated with them that may not be relational, so it would not be expressed as a relationship with another node.
In these cases, to represent data associated with nodes, we can use node properties (sometimes known as node attributes). Similarly, where an edge has additional information associated with it, in addition to representing a relationship, edge properties can be used to hold that data.
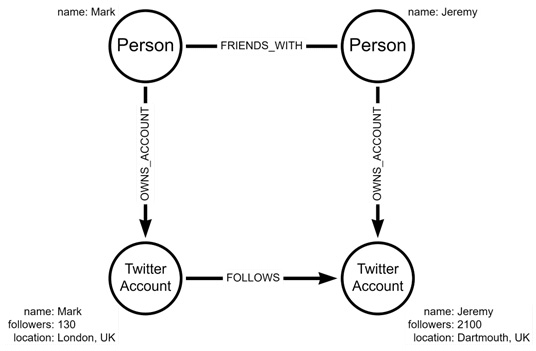
The following diagram shows a black line, indicating that Jeremy follows Mark but that Mark does not follow Jeremy – therefore, the black line indicates directionality:

Figure 1.3 – Two friend nodes are linked together with a single edge
In the preceding model, node properties are used to describe the number of followers Mark and Jeremy have, as well as the locations listed in their Twitter bios. This kind of additional node information is particularly important for querying graph data when asking questions that involve filtering.
In our Twitter example, properties would need to be present in the graph if, for example, we wanted to know who followed users with above 1,000 followers. We will revisit answering graphical questions using nodes, edges, and properties in later chapters.
Depending on the dataset, there may be cases where different nodes have different sets of properties. In this case, it is common to have several distinct types of nodes in the same graph.
Heterogeneous graphs
Node types can also be referred to as layers, or nodes with different labels, though for this book, they will be known simply as types.
The following diagram shows the nodes representing Jeremy and Mark as people, where each node type has different properties, and there are multiple relationship types. Due to this, we can term these multiple relationships as heterogenous:

Figure 1.4 – Example of a heterogenous Twitter graph
Now, we have added nodes representing Mark and Jeremy as people, relationships representing their relationship outside of Twitter, and their ownership of their respective accounts. Note that since we have increased the number of node types, we also need new edge types to refer to the different interactions between different types of nodes.
Graphs with multiple node types are known as heterogeneous, multilayer, or multilevel graphs, though going forward we will use the term heterogeneous to refer to graphs with multiple types of nodes. In contrast, graphs with only one node type, as in the previous examples, are referred to as homogeneous graphs.
Schema design
At this point, it is reasonable to ask the question: What features of a dataset should be nodes, edges, and properties?
For any given dataset, there are multiple ways to represent data as a graph, and each is more suited to different purposes. Herein lies the trick to good graph modeling: a question or use case-driven schema design.
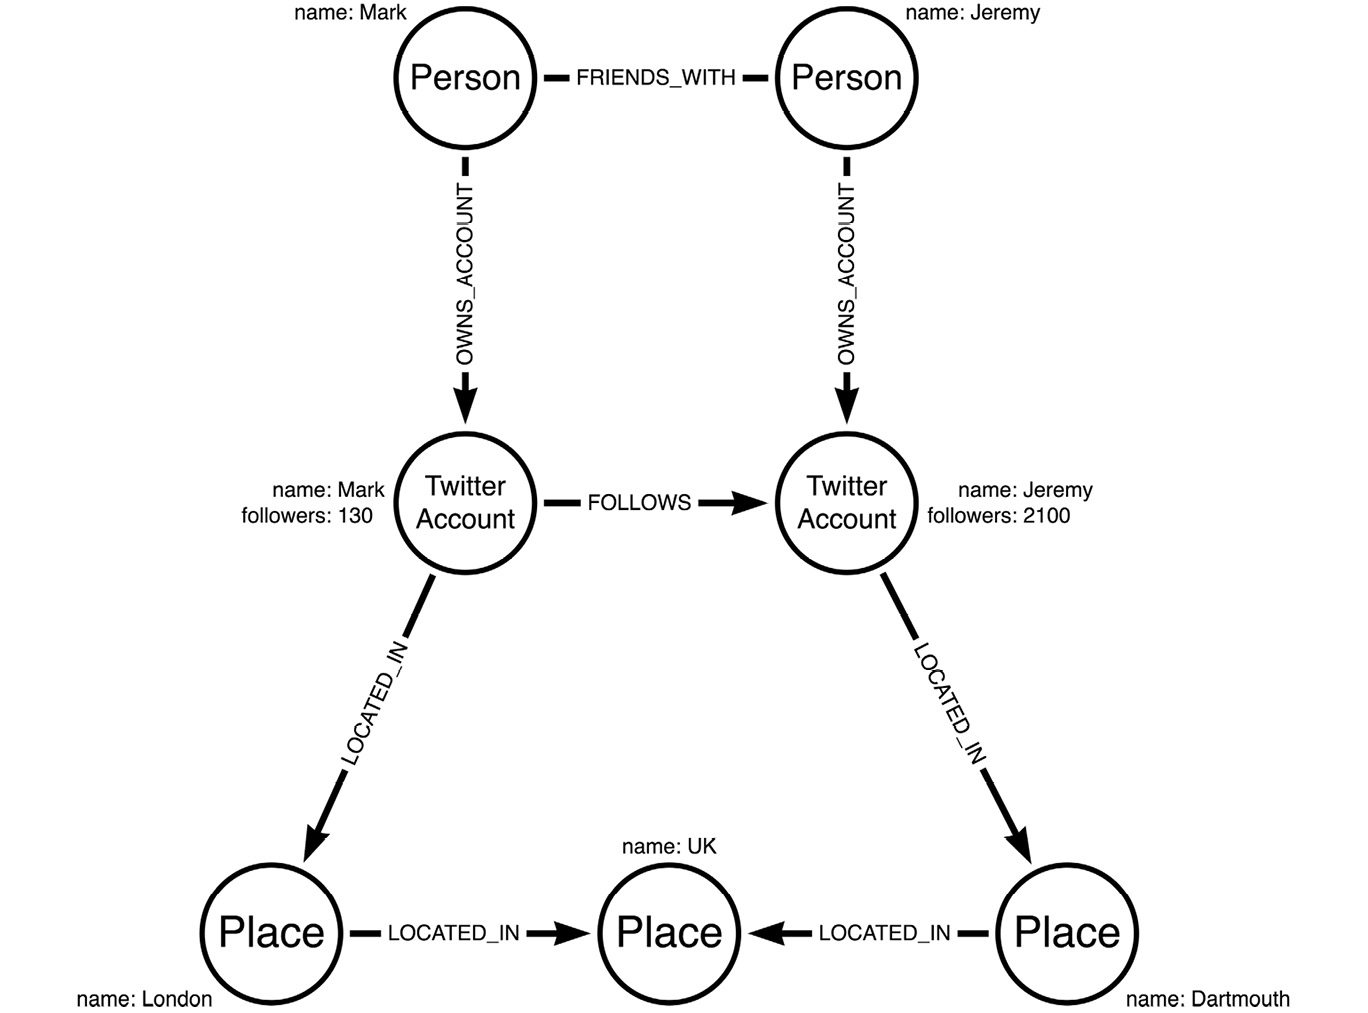
If we were particularly interested in the locations of Twitter users in our network, then we could move the location node property on the Twitter user nodes to create the LOCATED_IN relationship type. This is shown in the following diagram:

Figure 1.5 – The same graph but with the location property moved from a node property to a node type
If we were particularly interested in the locations of Twitter users in our network, then we could move the location node property on the Twitter user nodes to a separate node type and create the LOCATED_IN relationship type. We could even go one step further to represent the information we know about these locations, adding the country related to each location as a separate, abstracted node.
This graph structure models the same data in a different way, which may be more or less suitable or performant for particular use cases. We will explore the effects of schema design on the types of questions that can be asked, and performance, in later chapters.
In the next section, we will compare how graph data structures differ from traditional RDBs. This will expand on why GDBs can be more performant when modeled as a graph data problem.


