Sign In Start Free Trial
Account

Add to playlist

Create a Playlist

Modal Close icon
You need to login to use this feature.
  • Book Overview & Buying Extending Power BI with Python and R
  • Table Of Contents Toc
Extending Power BI with Python and R

Extending Power BI with Python and R - Second Edition

By : Luca Zavarella
5 (30)
close
close
Extending Power BI with Python and R

Extending Power BI with Python and R

5 (30)
By: Luca Zavarella

Overview of this book

The latest edition of this book delves deep into advanced analytics, focusing on enhancing Python and R proficiency within Power BI. New chapters cover optimizing Python and R settings, utilizing Intel's Math Kernel Library (MKL) for performance boosts, and addressing integration challenges. Techniques for managing large datasets beyond available RAM, employing the Parquet data format, and advanced fuzzy matching algorithms are explored. Additionally, it discusses leveraging SQL Server Language Extensions to overcome traditional Python and R limitations in Power BI. It also helps in crafting sophisticated visualizations using the Grammar of Graphics in both R and Python. This Power BI book will help you master data validation with regular expressions, import data from diverse sources, and apply advanced algorithms for transformation. You'll learn how to safeguard personal data in Power BI with techniques like pseudonymization, anonymization, and data masking. You'll also get to grips with the key statistical features of datasets by plotting multiple visual graphs in the process of building a machine learning model. The book will guide you on utilizing external APIs for enrichment, enhancing I/O performance, and leveraging Python and R for analysis. You'll reinforce your learning with questions at the end of each chapter.
Table of Contents (27 chapters)
close
close
23
Other Books You May Enjoy
24
Index
1
Appendix 1: Answers
2
Appendix 2: Glossary

Injecting R or Python scripts into Power BI

In this first section, Power BI Desktop tools that allow you to use Python or R scripts will be presented and described in detail. Specifically, you will see how to add your own code during the data loading, data transforming, and data viewing phases.

Data loading

One of the first steps required to work with data in Power BI Desktop is to import it from external sources:

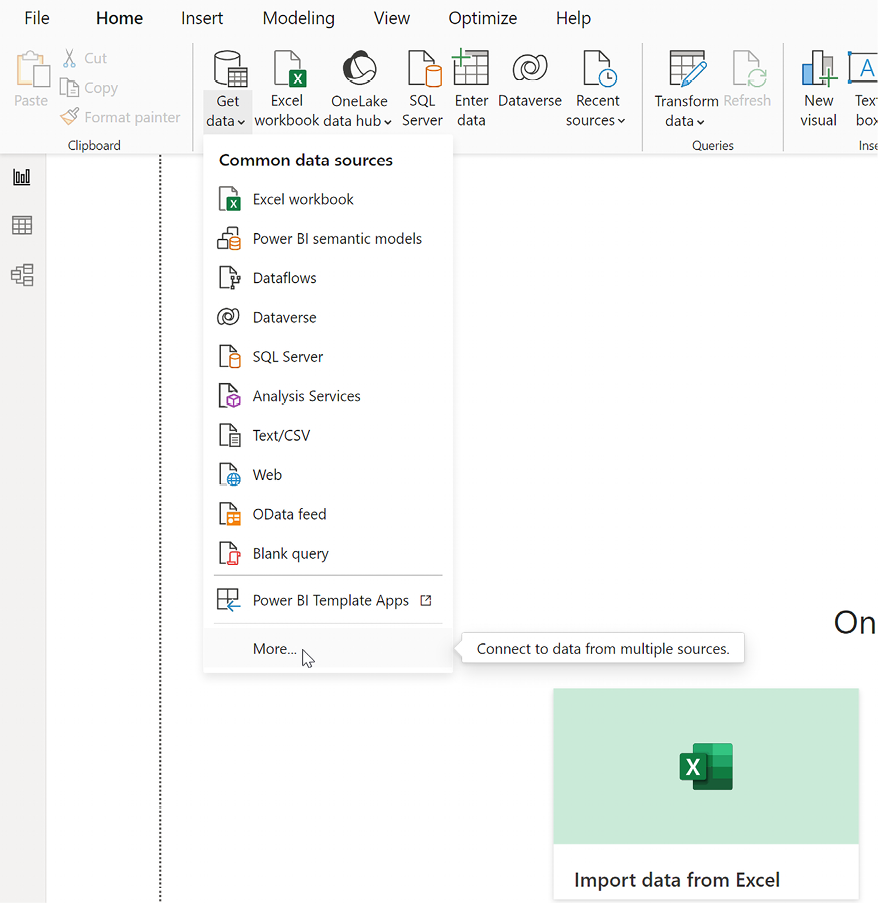
There are many connectors that allow you to do this, depending on the respective data sources, but you can also do it via scripts in Python and R. In fact, if you click on the Get data icon in the ribbon, not only are the most commonly used connectors shown but you can also select other ones from a more complete list by clicking on More...:

Graphical user interface, text, application  Description automatically generated

Figure 1.1: Browse more connectors to load your data

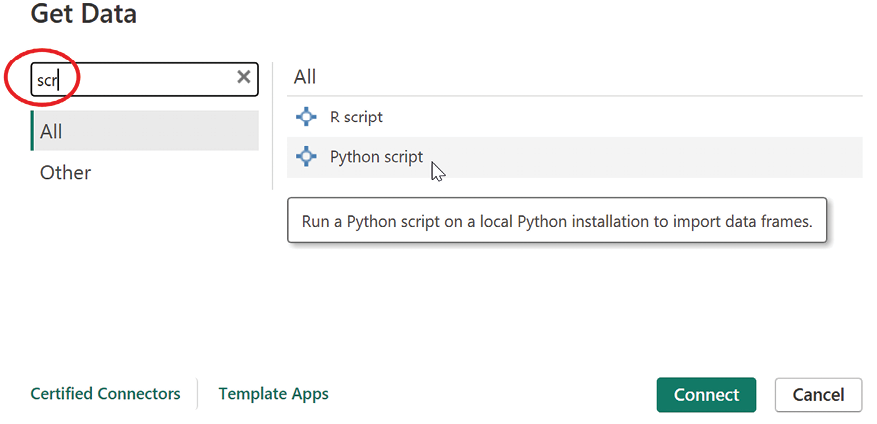
In the new Get Data window that pops up, simply start typing the word script into the search box, and immediately the two options for importing data via Python or R appear:

Figure 1.2 – Showing R script and Python script into the Get Data window

Figure 1.2: Showing R script and Python script in the Get Data window

Reading the contents of the tooltip, obtained by hovering the mouse over the Python script option, two things should immediately jump out at you:

  1. A local installation of Python is required.
  2. What can be imported through Python is a data frame.

The same two observations also apply when selecting R script. The only difference is that it is possible to import a pandas DataFrame when using Python (a DataFrame is a data structure provided by the pandas package), whereas R employs the two-dimensional array-like data structure called an R data frame, which is provided by default by the language.

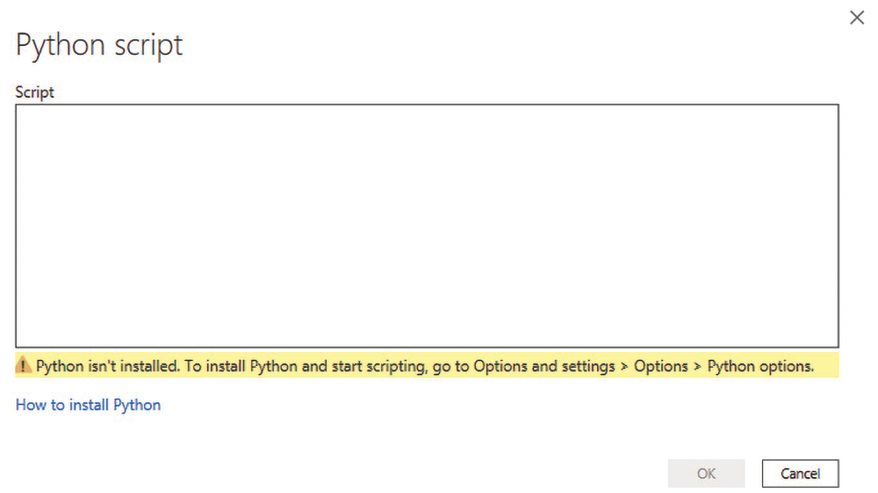
After clicking on the Python script option, a new window will be shown containing a text box for writing the Python code:

Figure 1.3 – Window showing the Python script editor

Figure 1.3: Window showing the Python script editor

As you can see, it’s definitely a very skimpy editor, but in Chapter 3, Configuring Python with Power BI, you’ll discover how you can utilize your preferred IDE to create your scripts within a more comprehensive and feature-rich editor.

Taking a look at the warning message, Power BI reminds you that no Python engine has been detected, so it must be installed. If you already have Python installed and configured, you will not see this message. Clicking on the How to install Python link will cause a Microsoft Docs web page to open, explaining the steps to install Python.

Microsoft suggests installing the base Python distribution, but in order to follow some best practices on environments (self-contained spaces that allow developers to manage dependencies, libraries, and configurations specific to individual projects), we will install the Miniconda distribution. The details of how to do this and why will be covered in Chapter 3.

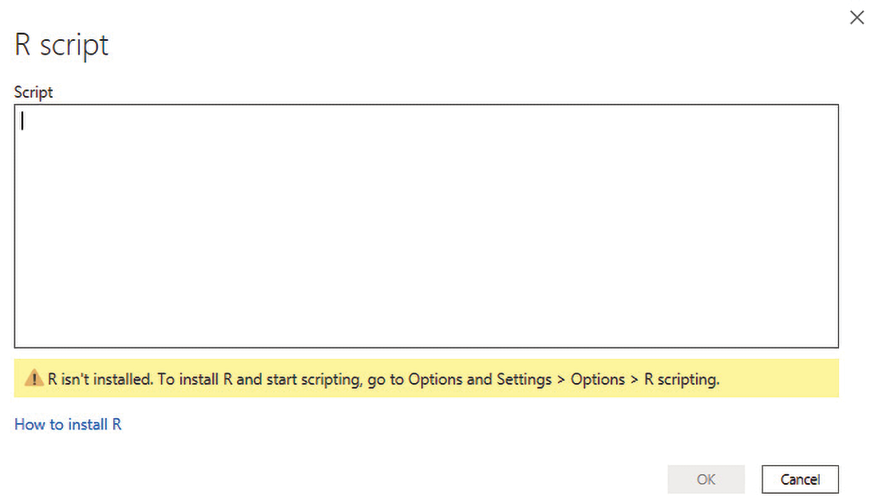
If you had clicked on R script instead, a window for entering code in R, similar to the one shown in Figure 1.4, would have appeared:

Figure 1.4 – Window showing the R script editor

Figure 1.4: Window showing the R script editor

As with Python, in order to run code in R, you need to install the R engine on your machine. Clicking on the How to install R link will open a Docs page where Microsoft suggests installing either Microsoft R Open or the classic CRAN R. Chapter 2, Configuring R with Power BI, will show you which engine to choose and how to configure your favorite IDE to write code in R.

In order to import data using Python or R, you need to write code in the editors shown in Figure 1.3 and Figure 1.4, which assign a pandas DataFrame or an R data frame to a variable, respectively. You will see concrete examples throughout this book.

Next, let’s look at transforming data.

Data transformation

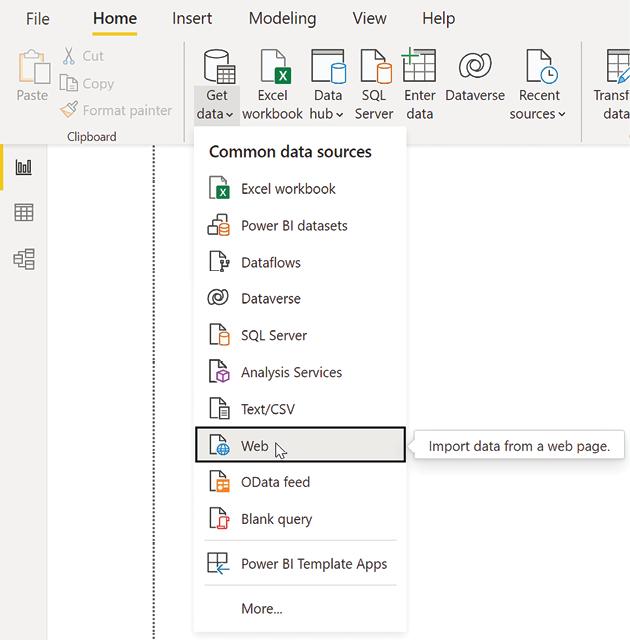
It is possible to apply a transformation to data already imported or being imported, using scripts in R or Python. Should you want to test this on the fly, you can import the following CSV file directly from the web: http://bit.ly/iriscsv. Follow these steps:

  1. Simply click on Get data and then Web to import data directly from a web page:
Graphical user interface, application  Description automatically generated

Figure 1.5: Select the Web connector to import data from a web page

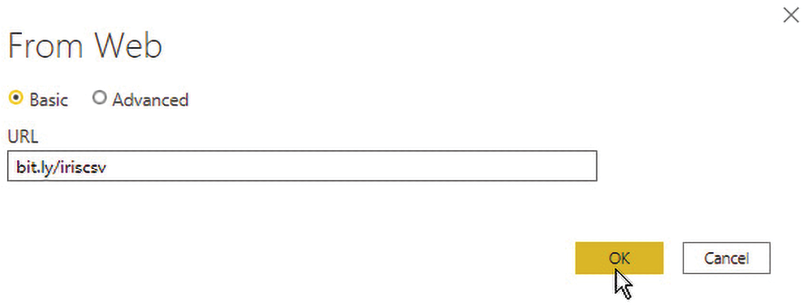
  1. You can now enter the previously mentioned URL in the window that pops up:
Figure 1.6 – Import the Iris data from the web

Figure 1.6: Import the Iris data from the web

  1. Right after clicking OK, a window will pop up with a preview of the data to be imported.

    In this case, instead of importing the data as is, click on Transform Data in order to access the Power Query data transformation window:

    Table  Description automatically generated

    Figure 1.7: Imported data preview

    It is at this point that you can add a transformation step using a Python or R script by selecting the Transform tab in Power Query Editor:

    Graphical user interface, table, Excel  Description automatically generated

    Figure 1.8: R and Python script tools in Power Query Editor

    By clicking on Run Python script, you’ll cause a window, similar to the one you’ve already seen in the data import phase, to pop up:

    Graphical user interface, text, application, email  Description automatically generated

    Figure 1.9: The Run Python script editor

    If you carefully read the comment in the text box, you will see that the dataset variable is already initialized and contains the data present at that moment in Power Query Editor, including any transformations already applied. At this point, you can insert your Python code in the text box to transform the data into the desired form.

    A similar window will open if you click on Run R script:

    Graphical user interface, text, application, email  Description automatically generated

    Figure 1.10: The Run R script editor

Also, in this case, the dataset variable is already initialized and contains the data present at that moment in Power Query Editor. You can then add your own R code and reference the dataset variable to transform your data in the most appropriate way.

Next, let’s look at visualizing data.

Data visualization

Finally, your own Python or R scripts can be added to Power BI to create new visualizations, in addition to those already present in the tool out of the box:

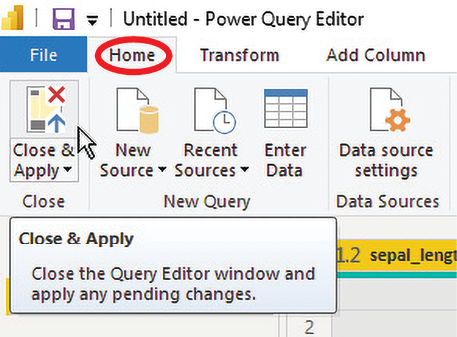
  1. Assuming we resume the data import activity started in the previous section, once the Iris dataset is loaded, simply click Cancel in the Run R script window, and then click Close & Apply in the Home tab of Power Query Editor:
Figure 1.11 – Click Close & Apply to import the Iris data

Figure 1.11: Click Close & Apply to import the Iris data

  1. After the data import is complete, you can select either the R visual or Python visual option in the Visualizations pane of Power BI:
    Diagram  Description automatically generated

    Figure 1.12: The R and Python script visuals

    If you click on Python visual, a window pops up asking for permission to enable script code execution, as there may be security or privacy risks:

    Figure 1.13 – Enable the script code execution

    Figure 1.13: Enable the script code execution

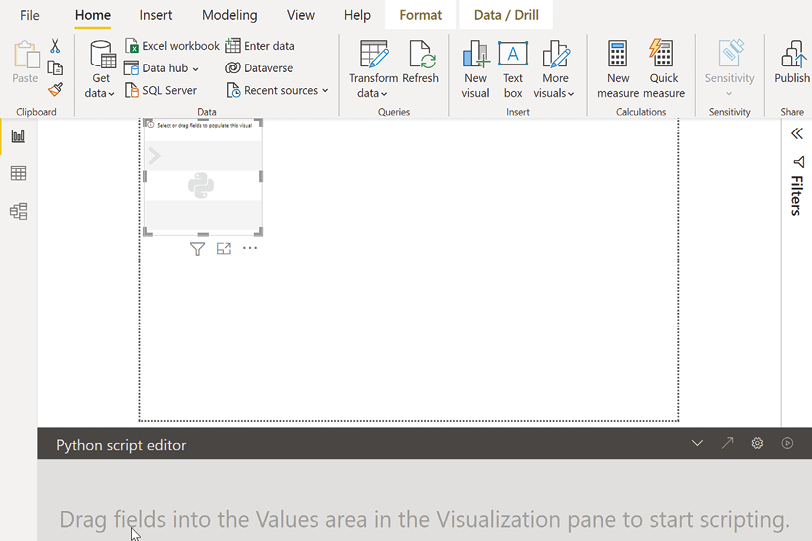
  1. After enabling code execution, in Power BI Desktop, you can see a placeholder for the Python visual image on the report canvas and a Python script editor pane at the bottom:
Graphical user interface, application  Description automatically generated

Figure 1.14: The Python visual layout

Once you drag the fields you want to use in your Python script into the Values area, you can write your own custom code into the Python script editor and run it to generate a Python visualization.

A pretty much identical layout occurs when you select R visual.

CONTINUE READING
83
Tech Concepts
36
Programming languages
73
Tech Tools
Icon Unlimited access to the largest independent learning library in tech of over 8,000 expert-authored tech books and videos.
Icon Innovative learning tools, including AI book assistants, code context explainers, and text-to-speech.
Icon 50+ new titles added per month and exclusive early access to books as they are being written.
Extending Power BI with Python and R
notes
bookmark Notes and Bookmarks search Search in title playlist Add to playlist download Download options font-size Font size

Change the font size

margin-width Margin width

Change margin width

day-mode Day/Sepia/Night Modes

Change background colour

Close icon Search
Country selected

Close icon Your notes and bookmarks

Confirmation

Modal Close icon
claim successful

Buy this book with your credits?

Modal Close icon
Are you sure you want to buy this book with one of your credits?
Close
YES, BUY

Submit Your Feedback

Modal Close icon
Modal Close icon
Modal Close icon