


-
Book Overview & Buying
-
Table Of Contents

Extending Power BI with Python and R - Second Edition
By :


Extending Power BI with Python and R
By:
Overview of this book
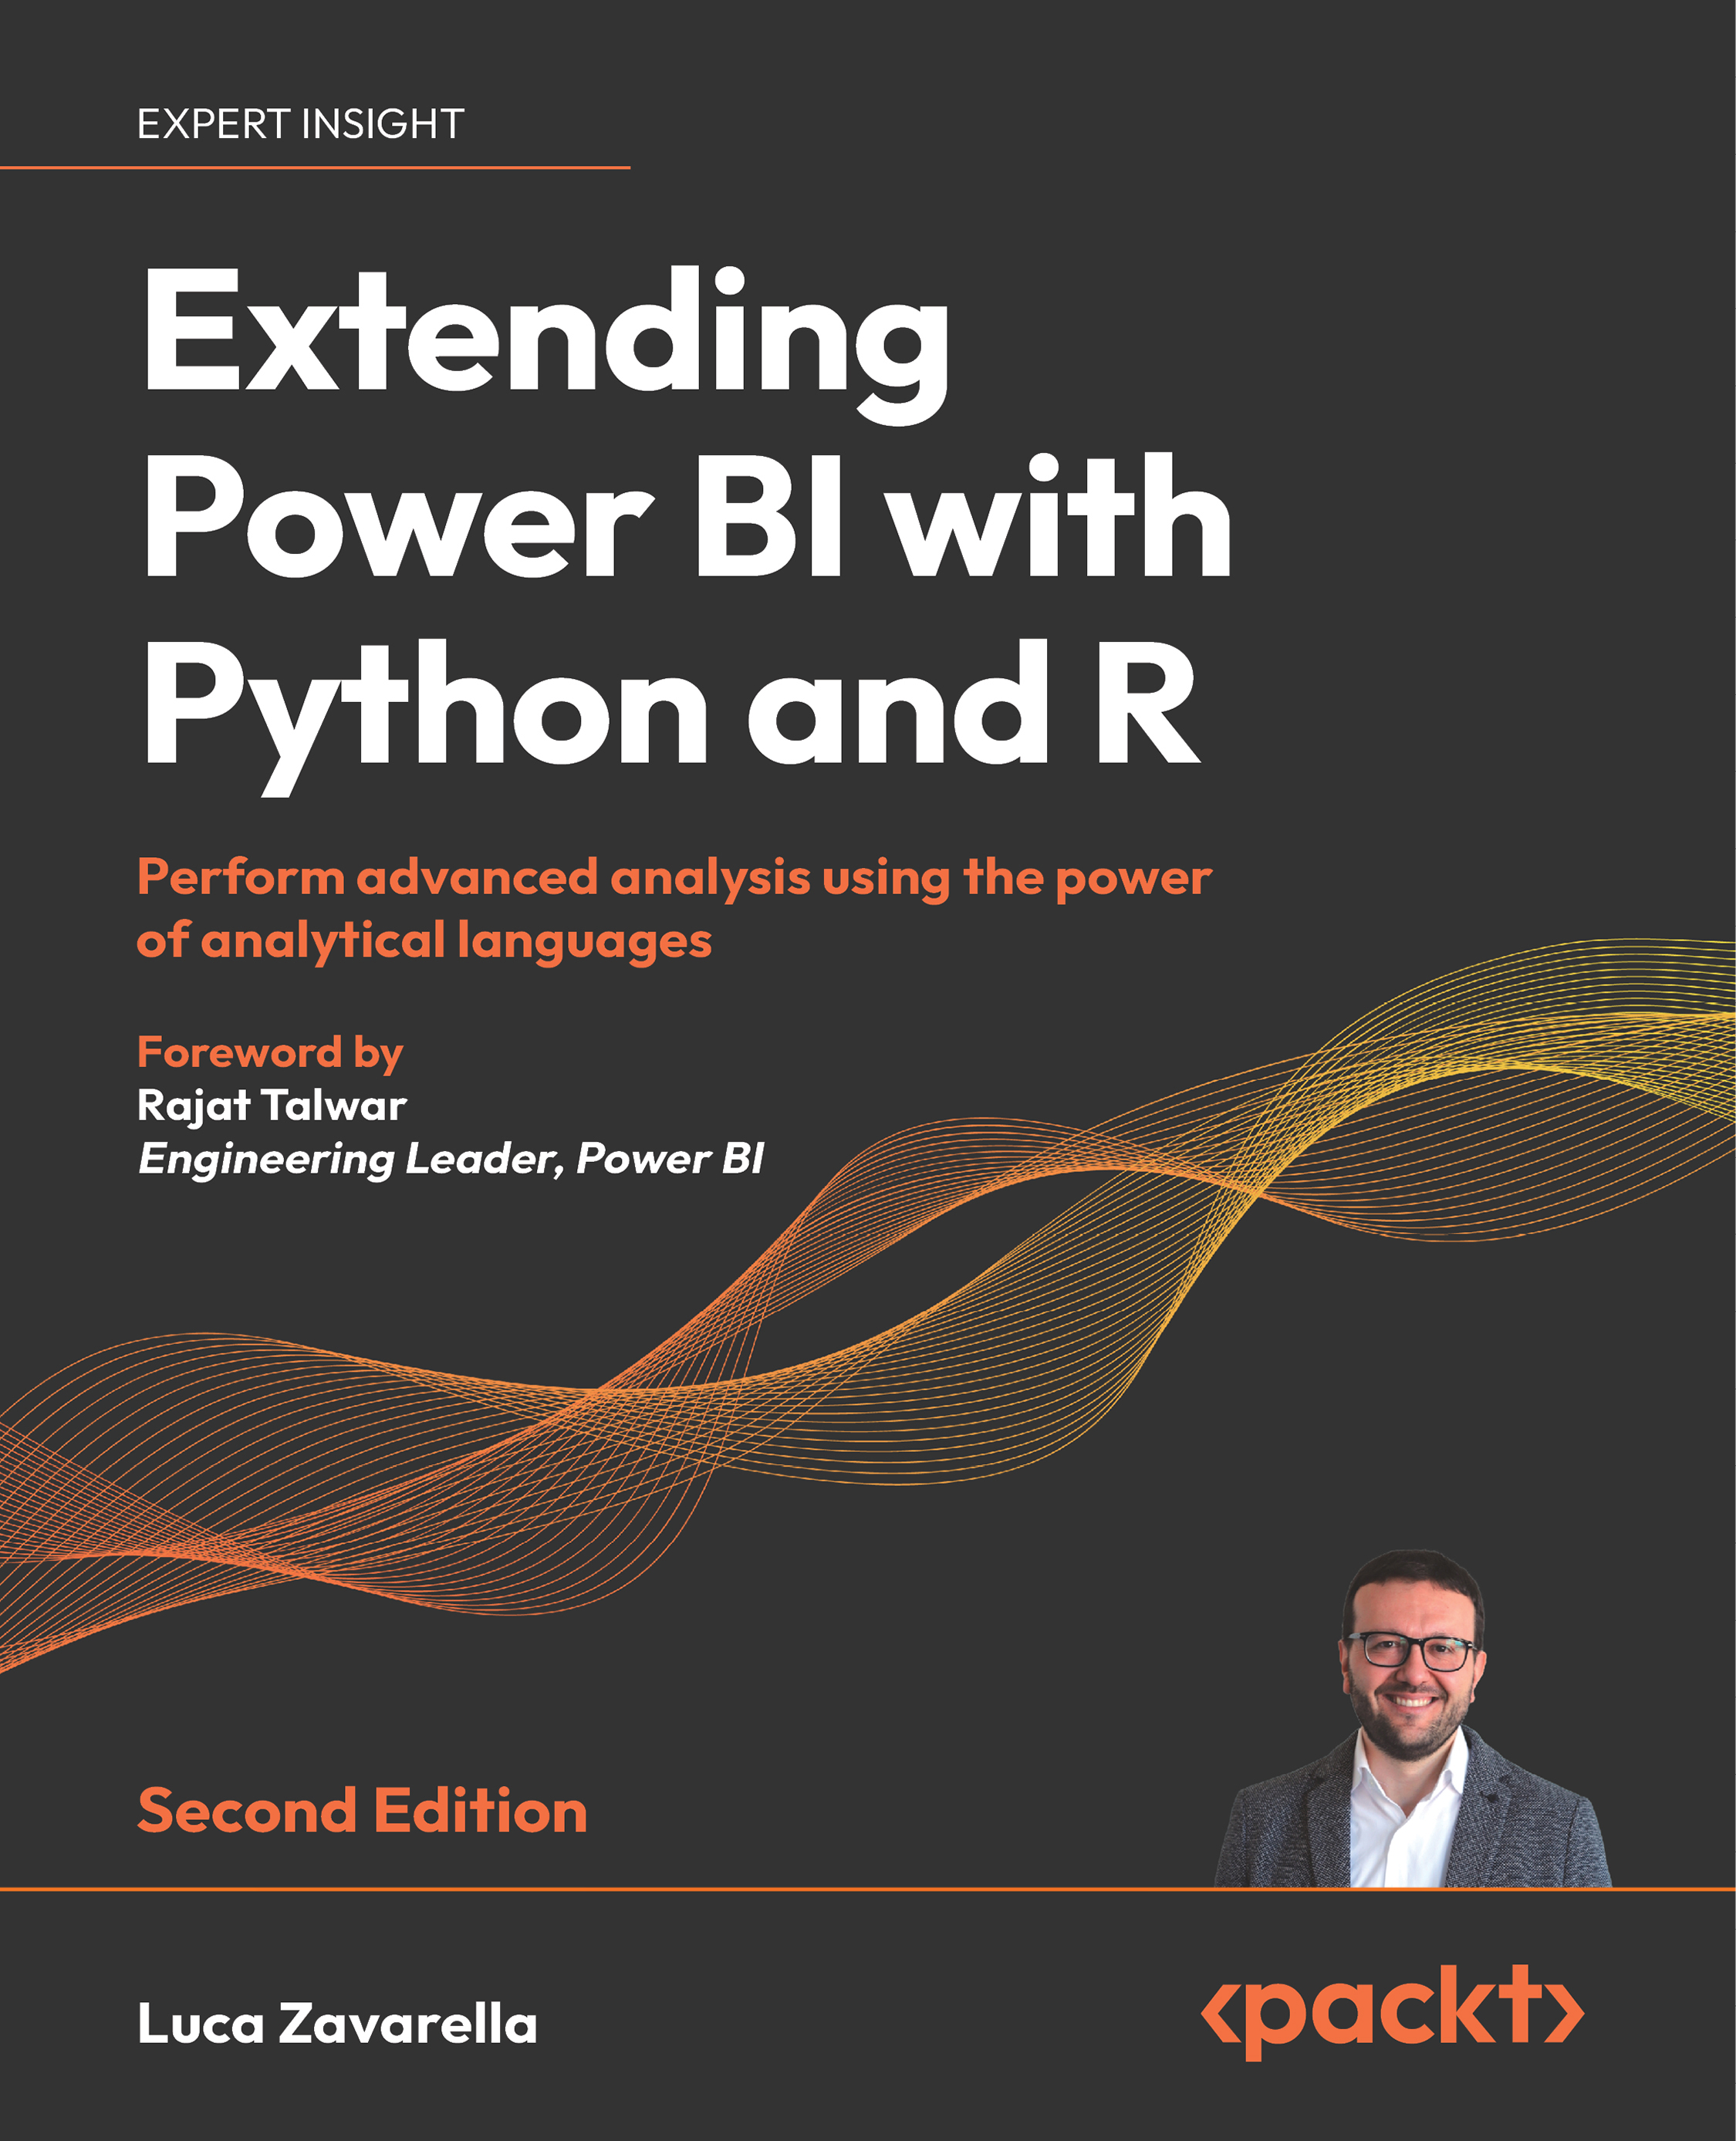
The latest edition of this book delves deep into advanced analytics, focusing on enhancing Python and R proficiency within Power BI. New chapters cover optimizing Python and R settings, utilizing Intel's Math Kernel Library (MKL) for performance boosts, and addressing integration challenges. Techniques for managing large datasets beyond available RAM, employing the Parquet data format, and advanced fuzzy matching algorithms are explored. Additionally, it discusses leveraging SQL Server Language Extensions to overcome traditional Python and R limitations in Power BI. It also helps in crafting sophisticated visualizations using the Grammar of Graphics in both R and Python.
This Power BI book will help you master data validation with regular expressions, import data from diverse sources, and apply advanced algorithms for transformation. You'll learn how to safeguard personal data in Power BI with techniques like pseudonymization, anonymization, and data masking. You'll also get to grips with the key statistical features of datasets by plotting multiple visual graphs in the process of building a machine learning model. The book will guide you on utilizing external APIs for enrichment, enhancing I/O performance, and leveraging Python and R for analysis.
You'll reinforce your learning with questions at the end of each chapter.
Table of Contents (27 chapters)
Preface


 Free Chapter
Where and How to Use R and Python Scripts in Power BI
Configuring R with Power BI
Configuring Python with Power BI
Solving Common Issues When Using Python and R in Power BI
Importing Unhandled Data Objects
Using Regular Expressions in Power BI
Anonymizing and Pseudonymizing Your Data in Power BI
Logging Data from Power BI to External Sources
Loading Large Datasets Beyond the Available RAM in Power BI
Boosting Data Loading Speed in Power BI with Parquet Format
Calling External APIs to Enrich Your Data
Calculating Columns Using Complex Algorithms: Distances
Calculating Columns Using Complex Algorithms: Fuzzy Matching
Calculating Columns Using Complex Algorithms: Optimization Problems
Adding Statistical Insights: Associations
Adding Statistical Insights: Outliers and Missing Values
Using Machine Learning without Premium or Embedded Capacity
Using SQL Server External Languages for Advanced Analytics and ML Integration in Power BI
Exploratory Data Analysis
Using the Grammar of Graphics in Python with plotnine
Advanced Visualizations
Interactive R Custom Visuals

Other Books You May Enjoy
Index
Appendix 1: Answers
Appendix 2: Glossary


