-
Book Overview & Buying
-
Table Of Contents

What's New in SQL Server 2012
By :
What's New in SQL Server 2012
By:
Overview of this book
Microsoft SQL Server has been part of the enterprise database landscape since SQL Server 7 arrived in 1998 and has evolved into the relational and BI platform of choice by businesses around the globe. The performance and full feature set of SQL Server has been widely recognized by the business community and it is viewed as a powerful weapon in their database and business intelligence arsenal. SQL Server brings numerous benefits to all businesses, central to which is a thorough understanding of the technology, both current and new.This is the book both DBAs and developers always wanted to buy but could never find in the bookstore. This is a SQL Server book that contains only the new features introduced in SQL Server 2012.This book will give you a competitive advantage by helping you to quickly learn and understand the new features of SQL Server 2012. Most readers will already have an established knowledge of SQL Server and will want to update their 2008/2008R2 knowledge swiftly with least pain.This book takes you through all of the new features of SQL Server 2012, from installing core database services and features, to the new administration and updated Transact-SQL functions. You will discover the new Analysis Services features, introduce data alerts and reporting features and explore the new enhancements to Integration Services. In addition you will learn how to automate, cleanse and transform critical business data with DQS and world-class enterprise level availability features.Finally, you will venture into simulating real-world database loads using Distributed Replay and complete your journey with a look at the new SQL Server cloud services and the new Hadoop big data platform.
Table of Contents (19 chapters)
What's New in SQL Server 2012

Credits
About the Authors
Acknowledgment
Acknowledgment
About the Reviewers
www.PacktPub.com
Preface

SQL Server Administration
Transact SQL
Analysis Services
Reporting Services
Integration Services
Data Quality Services
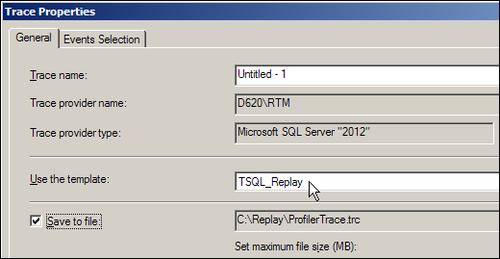
Distributed Replay
Big Data and the Cloud
Index