

Let's plot the window functions available in NumPy:
import numpy as np
import matplotlib.pyplot as plt
plt.figure(figsize=(6,4))
plt.plot(np.bartlett(51), label="Bartlett")
plt.plot(np.blackman(51), label="Blackman")
plt.plot(np.hamming(51), label="Hamming")
plt.plot(np.hanning(51), label="Hanning")
plt.plot(np.kaiser(51,3), label="Kaiser")
plt.legend(loc='best')
plt.savefig('window_functions.png')
plt.close()
The output is shown below:
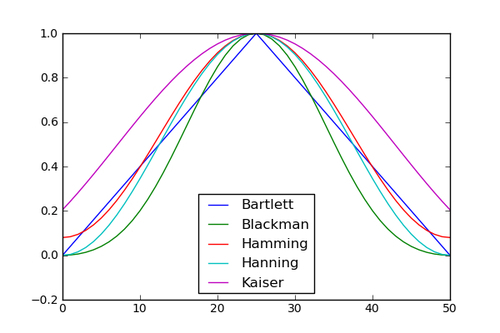
Calling the function hamming(51) returns an array containing 51 samples of the Hamming window function. The sample at the centre of the array corresponds to the centre of the window, where it reaches the value of 1. The other window functions work the same way, except that the Kaiser window also requires a shape parameter.