

Online testing environment
The Testing tab on the right-hand side of the TIA Portal application contains tools that are used only when a device is connected via the Go online function.
If no device is connected to, the Testing tab will simply display No online connection in the central processing unit (CPU) operator panel, and other functions are not available.
The Go online function can be found on the top menu bar—it looks like this:

Figure 1.26 – Go online function
Once clicked, a connection dialog will open that allows CPUs and other devices to be searched for and connected to, as illustrated in the following screenshot:
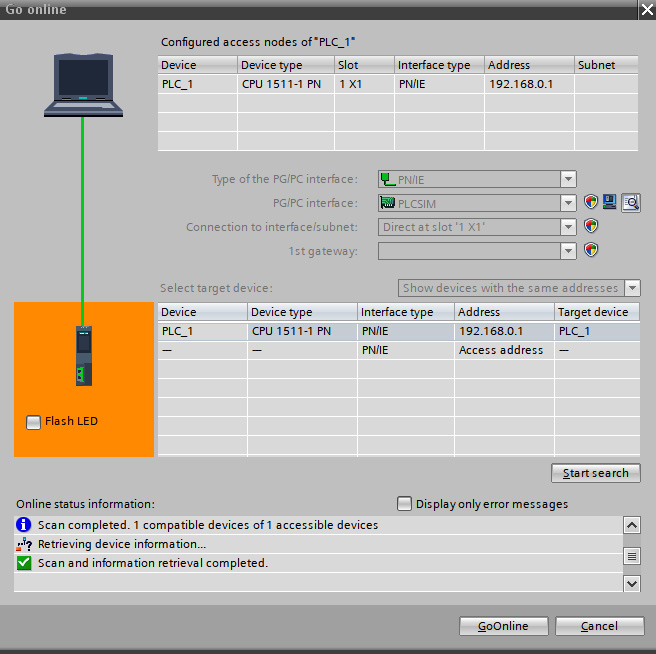
Figure 1.27 – Go online dialog that allows connection to devices
In the Go online dialog (Figure 1.27), devices can be searched for and connected to. Different interfaces can be selected from drop-down lists, and different subnets can be specified if required. Once the desired device is found, highlight it and click GoOnline. This will then connect the development environment to the device.
CPU operator panel
Once online, the Testing tab—specifically, the CPU operator panel—now contains data (if connected to a CPU in the project), as illustrated in the following screenshot:
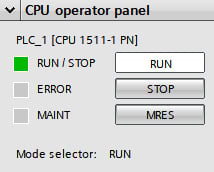
Figure 1.28 – CPU operator panel once online and connected to a CPU
These controls allow the CPU (PLC) to be stopped via the STOP button, memory reset via the MRES button, and placed back in to run via the RUN button.
The status of the CPU can also be read in this panel via the RUN/STOP, ERROR, and MAINT status LEDs. This is useful if the CPU is not local to the programming device running TIA Portal (connected via a virtual private network (VPN) connection, for example).
Call environment
The call environment is an important part of viewing and monitoring online code. In TIA Portal, a program block may be called more than once and via a different call environment (called by a different parent or instance). The Call environment panel in the Testing tab allows the call path to be defined, as illustrated in the following screenshot:
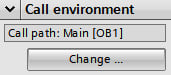
Figure 1.29 – Call environment panel
Figure 1.29 demonstrates a call path to a program block. When the Change … button is pressed, a list of available call paths is displayed. A call path can be selected, and TIA Portal will then monitor the selected call path.
Note – SIMATIC Manager
Programmers who have worked with Siemens SIMATIC Manager may remember that multiple calls to the same function block on the same call path mean that only the first instance is available to be monitored. TIA Portal rectifies this behavior by also allowing instances to be selected.
Breakpoints
Breakpoints are used to pause the execution of the CPU in order to help debug programming logic. They are only available in Structured Control Language (SCL) and Statement List (STL) languages and are not available on all CPUs.
Warning – Outputs
If a breakpoint halts the execution of the CPU, outputs may remain in their current state until the breakpoint is released! This could cause damage to assets or personnel. It is important to understand the risks associated with using breakpoints in a live equipment environment.
Breakpoints and their usage are advanced topics that relate only to textual languages. Using breakpoints effectively is covered in more detail in Chapter 5, Working with Languages in TIA Portal.
Call hierarchy
When in offline mode (not online with a CPU), the Call hierarchy pane always displays No call path available.
When in online mode with a CPU and actively monitoring a program block via the Monitor function ![]() , the Call hierarchy pane displays the relative call path to the block being monitored, as illustrated in the following screenshot:
, the Call hierarchy pane displays the relative call path to the block being monitored, as illustrated in the following screenshot:
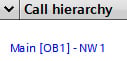
Figure 1.30 – Example of an object called by OB1
Figure 1.30 shows an example of a function block that is called by Main [OB1]. Should the block being monitored have multiple parents, the entire call hierarchy will be displayed.