

In this recipe, we will see how to embed StyleCop with your own tools. As an example, we will create a real-time analysis add-in for MonoDevelop/Xamarin Studio.
For this recipe, you will need to have:
StyleCop 4.7 installed
Xamarin Studio 4.0 or MonoDevelop 4.0
Note
MonoDevelop add-ins are library projects composed of two mandatory components:
An addin.xml file describing the add-in, its dependencies, and the dll files to load at runtime and the code of your add-in.
We will create an add-in with an executable command in the tool menu to activate or deactivate the real-time analysis.
Let's go to the part related to the StyleCop analysis itself; for this I will heavily rely on the code provided with this recipe:
We first initialize a StyleCop console in our command handler constructor (
RealTimeEgine.csline 85-87):this.console = new StyleCopConsole(null, true, null, null, true); this.console.OutputGenerated += this.OnOutputGenerated; this.console.ViolationEncountered += this.OnViolationEncountered;
The
StyleCopConsoleclass is the main entry point of the StyleCop analysis system, and it is able to run the analysis and report the violations found.We currently use default settings, but the arguments passed to the engine are really important if you want to embed specific settings or rule analyses.
The five constructor parameters are:
The first argument is the path to the settings you want to load. If it is set to null value, then it uses the default project settings files.
The second argument indicates whether we want to write results cache files or not.
The third argument is the path of the output file we want to write in.
The fourth argument is a list of paths to search for parser and analyzer add-ins. It can be set to null if no add-ins are provided.
The last argument indicates whether we want to load add-ins from the default path where the core binary is located.
After the initialization of our console, we indicate callbacks for its output and the violations encountered.
Now let's see the execution code itself (
RealTimeEgine.csline 166-180):Configuration configuration = new Configuration(new string[0]); List<CodeProject> projects = new List<CodeProject>(); CodeProject project = new CodeProject(IdeApp.ProjectOperations.CurrentSelectedProject.BaseDirectory.GetHashCode(),IdeApp.ProjectOperations.CurrentSelectedProject.BaseDirectory, configuration); // Add each source file to this project. this.console.Core.Environment.AddSourceCode(project, tmpFileName, null); projects.Add(project); this.console.Start(projects, false);
To execute the analysis, we have to define a Configuration object, this is used to allow StyleCop to analyze preprocessor regions (for example, if you want to analyze regions marked by a #if DEBUG, you should add the DEBUG string in this object).
After that, we configure our project itself; it's the common unit under which we analyze a subset of files. It takes an ID, a base path, and a configuration.
Then we add each source file related to the project, in our case it is a temporary file made of the content of the file currently being edited.
Finally, we start the console process. The callbacks we set up at the beginning will transmit the violations and the process message to the host.
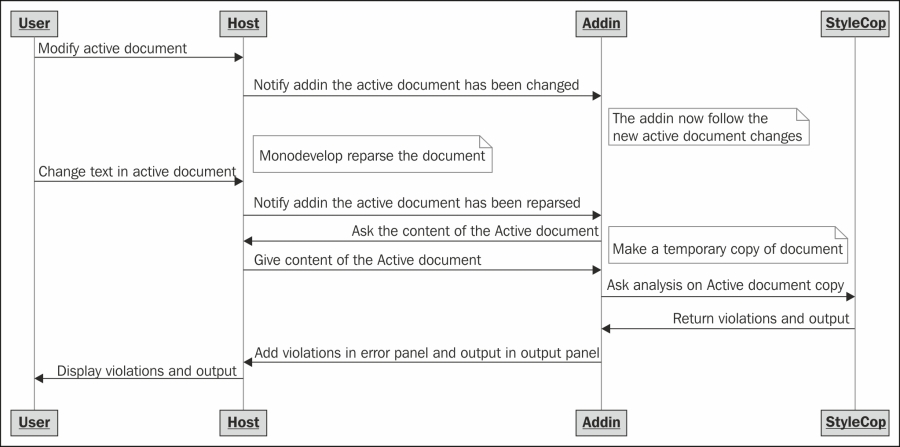
The add-in is plugged to two events of the MonoDevelop apps:
ActiveDocumentChanged: This event is called when the active document is "replaced" by another one.DocumentParsed: This event is called once the document has been correctly parsed by MonoDevelop. It is run after almost every modification in the text editor.
Following is the sequence diagram of the add-in:
You should have a look at the full source code to understand how the add-in really works.
The current add-in is just the beginning. It currently contains some drawbacks (first launch of StyleCop) and can be improved in many ways. Here some of them:
The add-in is currently not configurable. While this is not really important if you use the default parameters of StyleCop and don't have any custom rules, it will be mandatory for a finished product. It could at least define a way to add StyleCop settings and a path to check for custom rules.
One of the most significant drawback of the current implementation is that the UI freezes for one to two seconds during the first launch of the StyleCop analysis. To prevent this, we should put the StyleCop analysis in a separate thread to let the user interact with the interface during the analysis.