-
Book Overview & Buying
-
Table Of Contents

ArcGIS Pro 2.x Cookbook
By :
ArcGIS Pro 2.x Cookbook
By:
Overview of this book
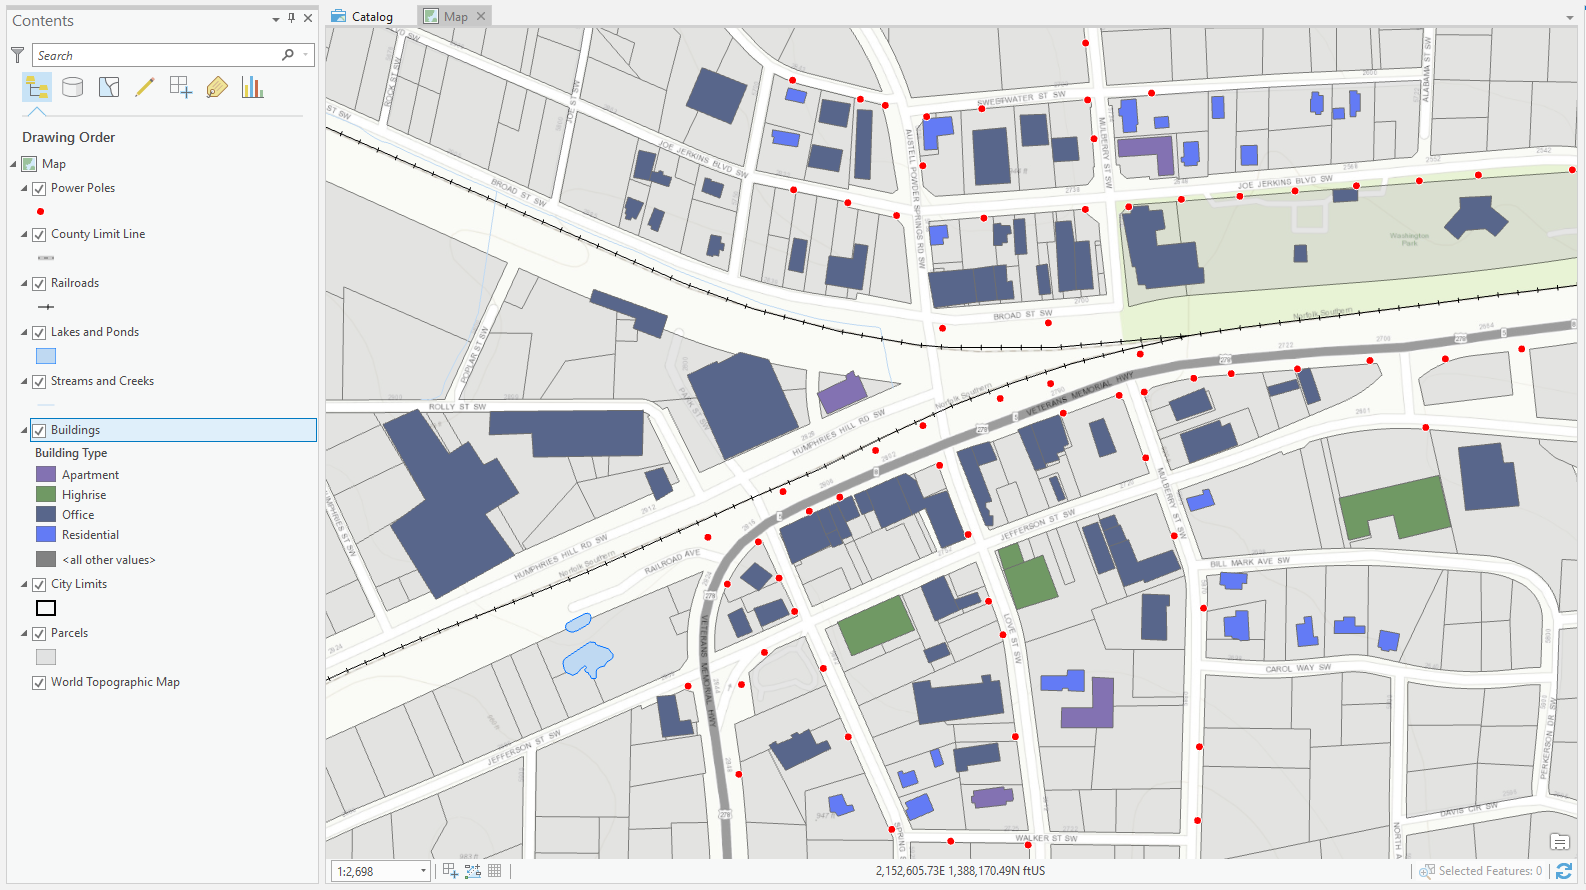
ArcGIS is Esri's catalog of GIS applications with powerful tools for visualizing, maintaining, and analyzing data. ArcGIS makes use of the modern ribbon interface and 64-bit processing to increase the speed and efficiency of using GIS. It allows users to create amazing maps in both 2D and 3D quickly and easily.
If you want to gain a thorough understanding of the various data formats that can be used in ArcGIS Pro and shared via ArcGIS Online, then this book is for you.
Beginning with a refresher on ArcGIS Pro and how to work with projects, this book will quickly take you through recipes about using various data formats supported by the tool. You will learn the limits of each format, such as Shapefiles, Geodatabase, and CAD files, and learn how to link tables from outside sources to existing GIS data to expand the amount of data that can be used in ArcGIS. You'll learn methods for editing 2D and 3D data using ArcGIS Pro and how topology can be used to ensure data integrity. Lastly the book will show you how data and maps can be shared via ArcGIS Online and used with web and mobile applications.
Table of Contents (21 chapters)
Title Page

Dedication
Packt Upsell
Contributors
Preface
 Free Chapter
ArcGIS Pro Capabilities and Terminology
Creating and Storing Data
Linking Data together
Editing Spatial and Tabular Data
Validating and Editing Data with Topologies
Projections and Coordinate System Basics
Converting Data
Proximity Analysis
Spatial Statistics and Hot Spots
3D Maps and 3D Analyst
Introducing Arcade
Introducing ArcGIS Online
Publishing Your Own Content to ArcGIS Online
Creating Web Apps Using ArcGIS Online
Other Books You May Enjoy
Index