


-
Book Overview & Buying
-
Table Of Contents

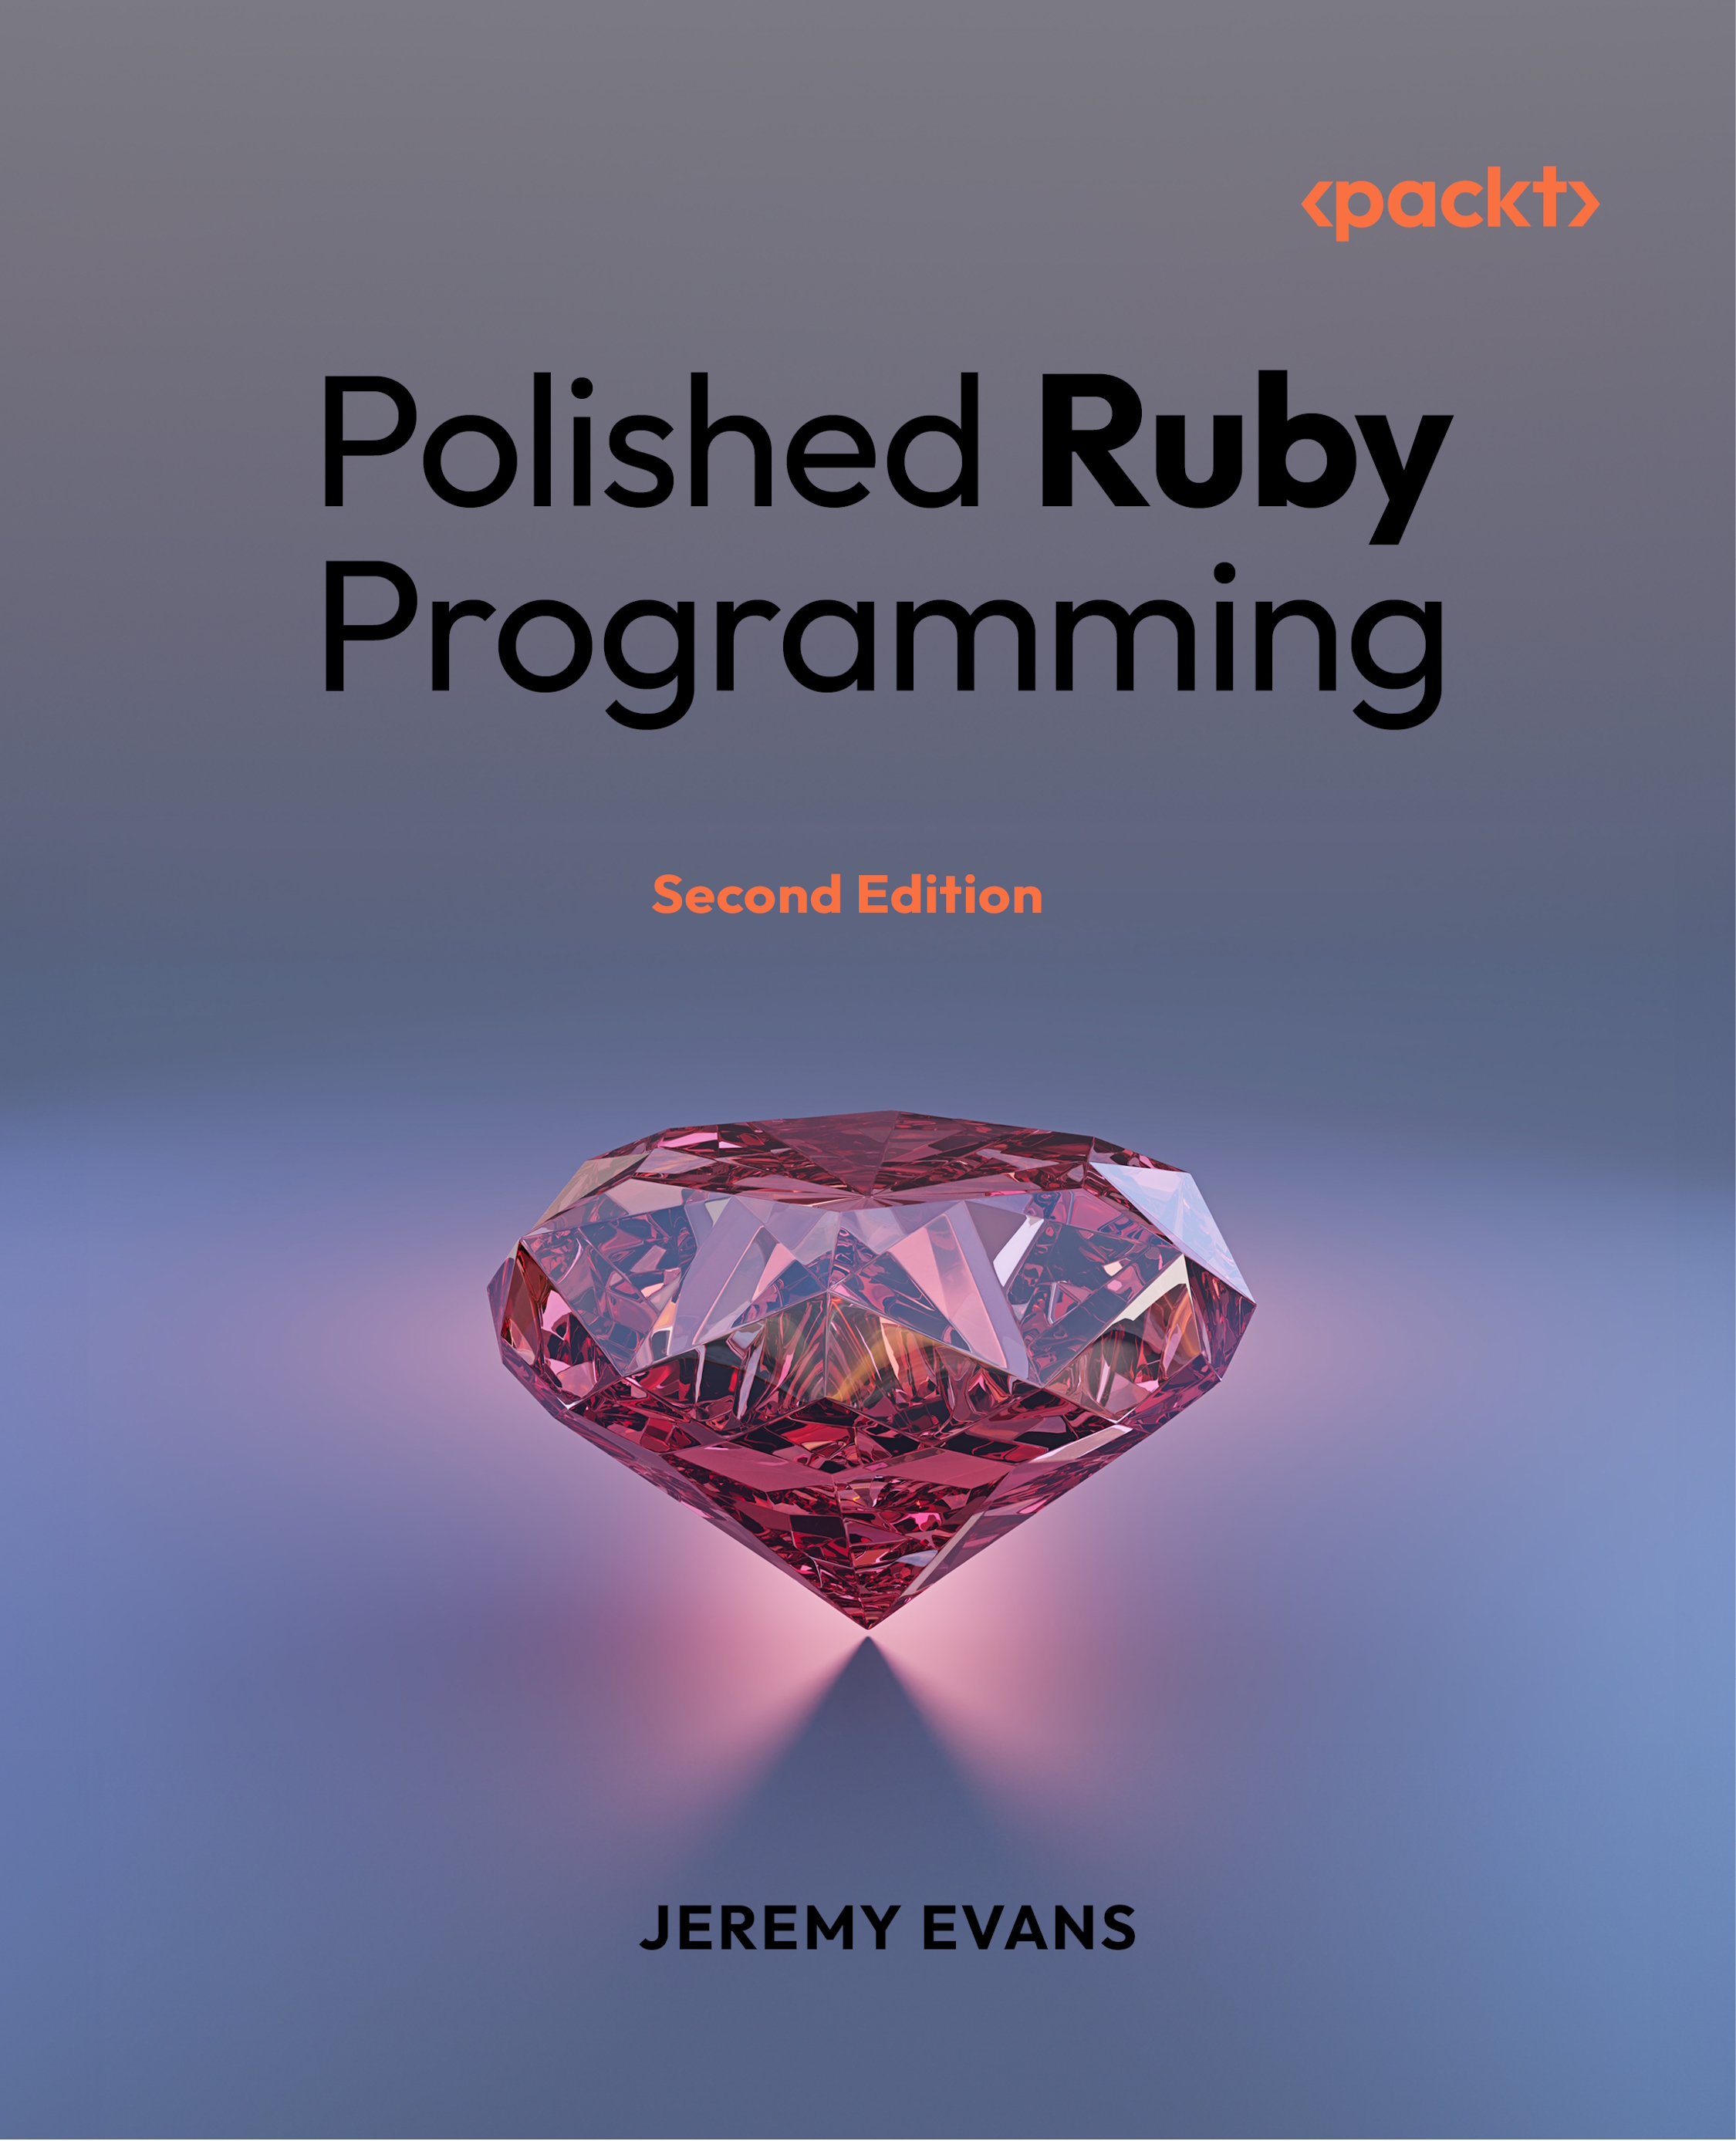
Polished Ruby Programming - Second Edition
By :


Polished Ruby Programming
By:
Overview of this book
Most successful Ruby applications become more difficult to maintain as the codebase grows in size. Polished Ruby Programming, 2nd Edition provides you with the skills and advice you need to design Ruby programs and libraries that are robust, performant, scalable, and maintainable.
The book takes you through possible implementation approaches for many common programming situations, discusses the trade-offs inherent in each approach, and explains why you may sometimes choose to use different approaches. You'll start by learning fundamental Ruby programming principles, such as correctly using core classes, class and method design, variable usage, error handling, and code formatting. Then you’ll move on to higher-level topics such as library design, metaprogramming, domain-specific languages, and refactoring. Finally, you'll learn about the pros and cons of different approaches to concurrency, what you should consider when deciding whether to use static types in your Ruby code, and how best to optimize your Ruby code.
The 2nd edition of Polished Ruby Programming has been updated to include relevant changes between Ruby 3.0 and 4.0. While most principles discussed in the book apply to all recent Ruby versions, some of the content in the book is specific to Ruby 4.0, the latest release at the time of publication.
Table of Contents (20 chapters)
Preface


Chapter 1: Getting the Most out of Core Classes
 Free Chapter
Chapter 2: Designing Useful Classes
Chapter 3: Proper Variable Usage
Chapter 4: Methods and Their Parameters
Chapter 5: Handling Errors
Chapter 6: Formatting Code for Easy Reading
Chapter 7: Designing Your Library
Chapter 8: Designing for Extensibility
Chapter 9: Metaprogramming and When to Use It
Chapter 10: Designing Useful Domain-Specific Languages
Chapter 11: Testing to Ensure Your Code Works
Chapter 12: Handling Change
Chapter 13: Using Common Design Patterns
Chapter 14: Choosing Your Concurrency Approach
Chapter 15: Static or Duck
Chapter 16: Optimizing Your Code

Chapter 17: Unlock Your Exclusive Benefits
Other Books You May Enjoy
Index


