Now that we have a better understanding of geospatial analysis, the next step is to build a simple GIS, known as SimpleGIS, using Python. This small program will be a technically complete GIS with a geographic data model that can render the data as a visual thematic map showing the population of different cities.
The data model will also be structured so that you can perform basic queries. Our SimpleGIS will contain the state of Colorado, three cities, and population counts for each city.
Most importantly, we will demonstrate the power and simplicity of Python programming by building this tiny system in pure Python. We will only use modules available in the standard Python distribution without downloading any third-party libraries.
Getting started with Python
As we stated earlier, this book assumes that you have some basic knowledge of Python. The only module that’s used in the following example is the turtle module, which provides a very simple graphics engine based on the Tkinter library, which is included with Python. In this book, we will use the Anaconda environment, which provides a Python environment plus a simple package manager called conda that will make installing any additional geospatial libraries we need easier. You can find the installer and installation instructions for your platform at https://conda.io/projects/conda/en/latest/user-guide/install/index.html. Once you have installed Anaconda, open the Anaconda PowerShell prompt. This will give you a command line to run Python interactively, as well as scripts.
Make sure that you can import the turtle module by typing the following in the command prompt. This will run the Turtle demo script:
python –m turtle
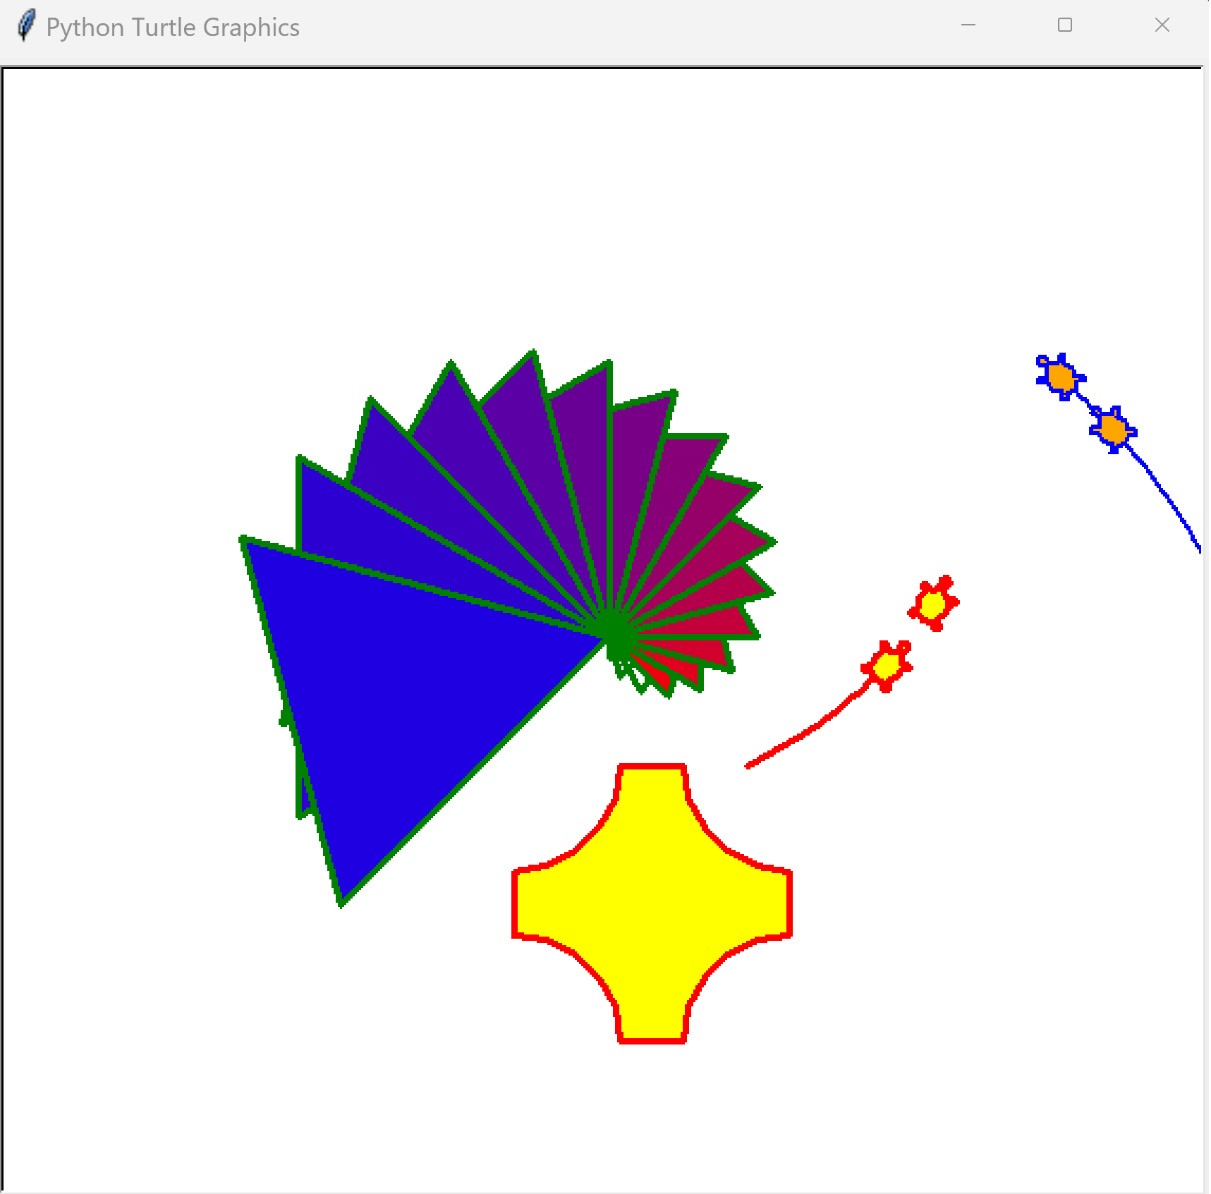
The preceding command will begin a real-time drawing program that will demonstrate the capabilities of the turtle module, as shown in the following screenshot:
Figure 1.24 – The output of the Python Turtle graphics library
Now that we’ve seen what the turtle graphics module can do, let’s use it to build an actual GIS!
Building a SimpleGIS
The code is divided into two different sections:
- The data model section
- The map renderer that draws the data
For the data model, we will use simple Python lists. A Python list is a native data type that serves as a container for other Python objects in a specified order. Python lists can contain other lists and are great for simple data structures. They also map well to more complex structures or even databases if you decide you want to develop your script further.
The second portion of the code will render the map using the Python Turtle graphics engine. We will have only one function in the GIS that converts the world coordinates – in this case, longitude and latitude – into pixel coordinates. All graphics engines have an origin point of (0,0) and it’s usually in the top-left or lower-left corner of the canvas.
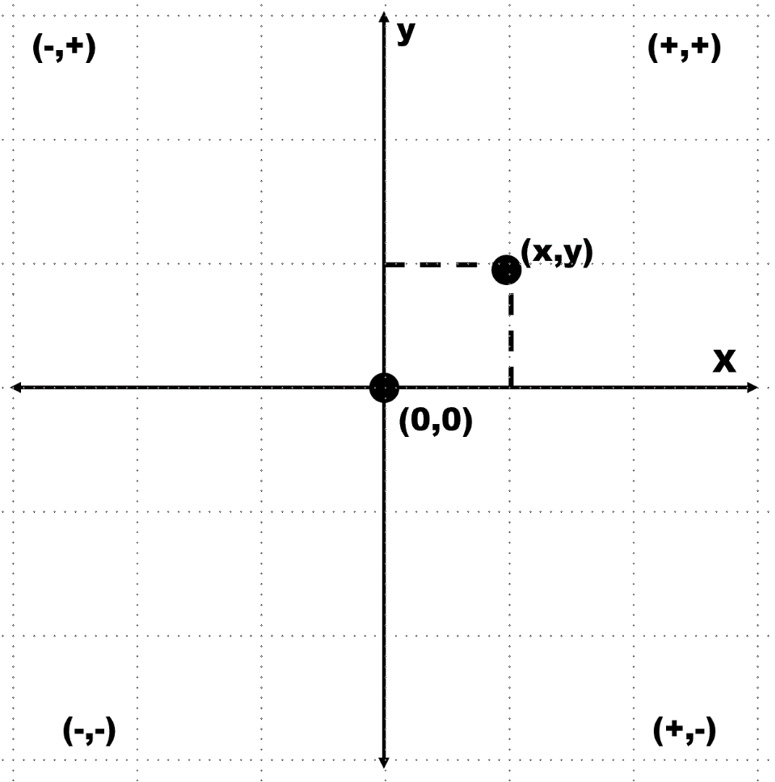
Turtle graphics are designed to teach programming visually. The Turtle graphics canvas uses an origin of (0,0) in the center, similar to a graphing calculator. The following graph illustrates the type of Cartesian graph that the turtle module uses. Some of the points are plotted in both positive and negative space:
Figure 1.25 – The turtle module uses a standard Cartesian graph to plot coordinates
This also means that the Turtle graphics engine can have negative pixel coordinates, which is uncommon for graphics canvases. However, for this example, the turtle module is the quickest and simplest way for us to render our map.
Setting up the data model
You can run this program interactively in the Python interpreter or you can save the complete program as a script and run it. The Python interpreter is an incredibly powerful way to learn about new concepts because it gives you real-time feedback on errors or unexpected program behavior. You can easily recover from these issues and try something else until you get the results that you want:
- In Python, you usually import modules at the beginning of the script, so we’ll import the
turtle module first. We’ll use Python’s import feature to assign the module the name t to save space and time when typing turtle commands:import turtle as t
- Next, we’ll set up the data model, starting with some simple variables that allow us to access list indexes by name instead of numbers to make the code easier to follow. Python lists index the contained objects, starting with the number
0. So, if we wanted to access the first item in a list called myList, we would reference it as follows:myList[0]
- To make our code easier to read, we can also use a variable name that’s been assigned to commonly used indexes:
firstItem = 0 myList[firstItem]
In computer science, assigning commonly used numbers to an easy-to-remember variable is a common practice. These variables are called constants. So, for our example, we’ll assign constants for some common elements that are used for all of the cities. All cities will have a name, one or more points, and a population count:
NAME = 0POINTS = 1
POP = 2
- Now, we’ll set up the data for Colorado as a list with a name, polygon points, and the population. Note that the coordinates are a list within a list:
state = ["COLORADO", [[-109, 37],[-109, 41],[-102, 41],[-102, 37]], 5187582]
- The cities will be stored as nested lists. Each city’s location consists of a single point as a longitude and latitude pair. These entries will complete our GIS data model. We’ll start with an empty list called
cities and then append the data to this list for each city:cities = []cities.append(["DENVER",[-104.98, 39.74], 634265])
cities.append(["BOULDER",[-105.27, 40.02], 98889])
cities.append(["DURANGO",[-107.88,37.28], 17069])
- We will now render our GIS data as a map by first defining a map size. The width and height can be anything that you want, depending on your screen resolution:
map_width = 400map_height = 300
- To scale the map to the graphics canvas, we must first determine the bounding box of the largest layer, which is the state. We’ll set the map’s bounding box to a global scale and reduce it to the size of the state. To do so, we’ll loop through the longitude and latitude of each point and compare it with the current minimum and maximum X and Y values. If it is larger than the current maximum or smaller than the current minimum, we’ll make this value the new maximum or minimum, respectively:
Minx =     180Maxx =     -180
Miny =     90
Maxy =     -90
for x,y in state[POINTS]:
    if x < minx:
        minx = x
    elif x > maxx:
        maxx = x
    if y < miny:
        miny = y
    elif y > maxy:
        maxy = y
- The second step when it comes to scaling is calculating a ratio between the actual state and the tiny canvas that we will render it on. This ratio is used for coordinate-to-pixel conversion. We get the size along the X and Y axes of the state and then we divide the map’s width and height by these numbers to get our scaling ratio:
dist_x = maxx – minxdist_y = maxy – miny
x_ratio = map_width / dist_x
y_ratio = map_height / dist_y
- The following function, called
convert(), is our only function in SimpleGIS. It transforms a point in the map coordinates from one of our data layers into pixel coordinates using the previous calculations. You’ll notice that, in the end, we divide the map’s width and height in half and subtract it from the final conversion to account for the unusual center origin of the Turtle graphics canvas. Every geospatial program has some form of this function:def convert(point): lon = point[0] lat = point[1]
x = map_width - ((maxx - lon) * x_ratio)
y = map_height - ((maxy - lat) * y_ratio)
# Python turtle graphics start in the
# middle of the screen so we must offset
# the points so they are centered
x = x - (map_width/2)
y = y - (map_height/2) return [x,y]
Now comes the exciting part! We’re ready to render our GIS as a thematic map.
Rendering the map
The turtle module uses the concept of a cursor, known as a pen. Moving the cursor around the canvas is the same as moving a pen around a piece of paper. The cursor will draw a line when you move it. You’ll notice that, throughout the code, we use the t.up() and t.down() commands to pick the pen up when we want to move to a new location and put it down when we’re ready to draw. We have some important steps to follow in this section, so let’s get started:
- First, we need to set up the Turtle graphics window:
t.setup(900,600)t.screensize(800,500)
wn = t.Screen()
wn.title("Simple GIS")
- Since the border of Colorado is a polygon, we must draw a line between the last point and the first point to close the polygon. We can also leave out the closing step and just add a duplicate point to the Colorado dataset. Once we’ve drawn the state, we can use the
write() method to label the polygon:t.up()first_pixel = None
for point in state[POINTS]:
pixel = convert(point)
if not first_pixel:
first_pixel = pixel
t.goto(pixel)
t.down()
t.goto(first_pixel)
t.up() t.goto([0,0])
t.write(state[NAME], align="center", \ font=("Arial",16,"bold"))
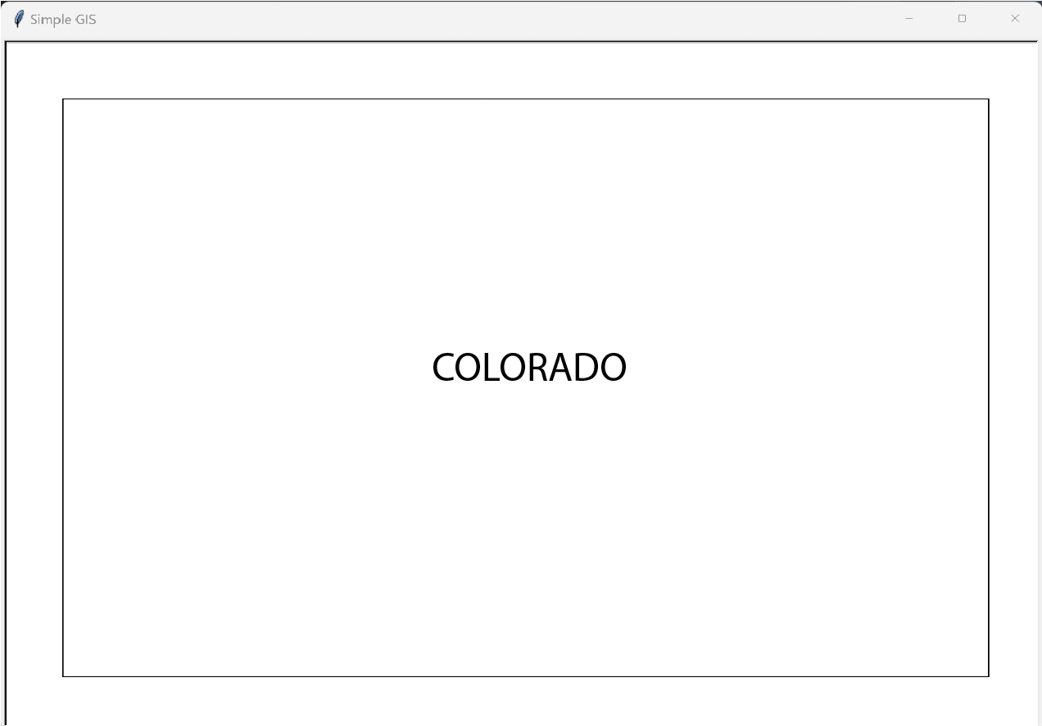
- If we were to run the code at this point, we would see a simplified map of the state of Colorado, as shown in the following screenshot. Note that if you run the previous code, you need to temporarily add
t.done() to the end to keep the window from automatically closing:
Figure 1.26 – A basemap of the state of Colorado, USA, produced by the SimpleGIS Python script
- Now, we’ll render the cities as point locations and label them with their names and population. Since the cities are a group of features in a list, we’ll loop through them to render them. Instead of drawing lines by moving the pen around, we’ll use Turtle’s
dot() method to plot a small circle at the pixel coordinate that’s returned by our SimpleGISconvert() function. We’ll then label the dot with the city’s name and add the population. You’ll notice that we must convert the population number into a string to use it in Turtle’s write() method. To do so, we will use Python’s built-in str() function:for city in cities: pixel = convert(city[POINTS]) t.up()
t.goto(pixel)
# Place a point for the city t.dot(10)
# Label the city
t.write(city[NAME] + ", Pop.: " + str(city[POP])\ , align="left")
t.up()
- Now, we will perform one last operation to prove that we have created a real GIS. We will perform an attribute query on our data to determine which city has the largest population. Then, we’ll perform a spatial query to see which city lies the furthest west. Finally, we’ll print the answers to our questions on our thematic map page safely, out of the range of the map.
- For our query engine, we’ll use Python’s built-in
min() and max() functions. These functions take a list as an argument and return the minimum and maximum values of this list, respectively. These functions have a special feature called a key argument that allows you to sort complex objects. Since we are dealing with nested lists in our data model, we’ll take advantage of the key argument in these functions. The key argument accepts a function that temporarily alters the list for evaluation before a final value is returned. In this case, we want to isolate the population values for comparison, and then the points. We could write a whole new function to return the specified value, but we can use Python’s lambda keyword instead. The lambda keyword defines an anonymous function that is used inline. Other Python functions can be used inline, such as the string function, str(), but they are not anonymous. This temporary function will isolate our value of interest.
- So, our first question is, which city has the largest population?
biggest_city = max(cities, key=lambda city:city[POP]) t.goto(0,-200)t.write("The biggest city is: " + biggest_city[NAME])
- The next question is, which city lies the furthest west?
western_city = min(cities, key=lambda city:city[POINTS]) t.goto(0,-220)t.write("The western-most city is: " + western_city[NAME])
- In the preceding query, we used Python’s built-in
min() function to select the smallest longitude value. This works because we represented our city locations as longitude and latitude pairs. It is possible to use different representations for points, including possible representations where this code would need to be modified to work correctly. However, for our SimpleGIS, we are using a common point representation to make it as intuitive as possible.
- These last two commands are just for cleanup purposes. First, we hide the cursor. Then, we call Turtle’s
done() method, which will keep the Turtle graphics window with our map on it open until we choose to close it using the close handle at the top of the window:t.pen(shown=False)t.done()
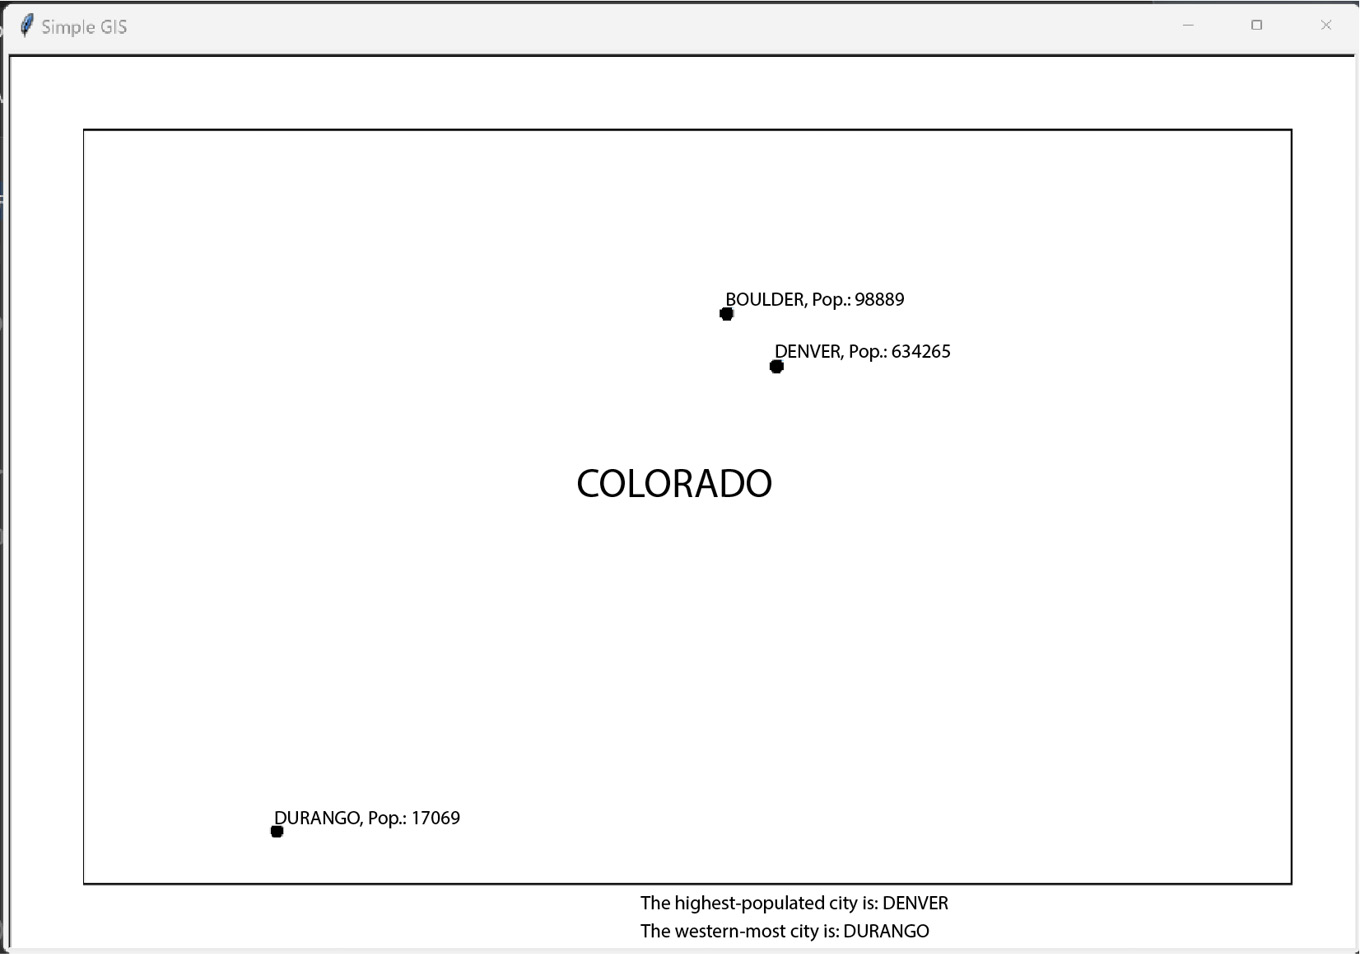
Whether you followed along using the Python interpreter or you ran the complete program as a script, you should see the following map being rendered in real time:
Figure 1.27 – The final output of the SimpleGIS script illustrating a complete GIS in only 60 lines of Python
Congratulations! You have followed in the footsteps of Paleolithic hunters, the father of GIS Dr. Roger Tomlinson, geospatial pioneer Howard Fisher, and game-changing humanitarian programmers to create a functional, extensible, and technically complete GIS.
It took less than 60 lines of pure Python code! You will be hard-pressed to find a programming language that can create a complete GIS using only its core libraries in such a finite amount of readable code as Python. Even if you did, it is highly unlikely that the language would survive the geospatial Python journey that you’ll take through the rest of this book.
As you can see, there is lots of room for expansion when it comes to SimpleGIS. Here are some other ways that you might expand this simple tool using the reference material for Tkinter and Python that were linked at the beginning of this section:
- Create an overview map in the top-right corner with a US border outline and Colorado’s location in the US
- Add color for visual appeal and further clarity
- Create a map key for different features
- Make a list of states and cities and add more states and cities
- Add a title to the map
- Create a bar chart to compare population numbers visually
The possibilities are endless. SimpleGIS can also be used as a way to quickly test and visualize geospatial algorithms that you come across. If you want to add more data layers, you can create more lists, but these lists will become difficult to manage. In this case, you can use another Python module that’s included in the standard distribution. The SQLite module provides a SQL-like database in Python that can be saved to disk or run in memory.


 Free Chapter