
This recipe covers how to debug your Rails application including watching variables, program stack, and breakpoints.
Although the Borg are perfect, sometimes it is necessary to find problems in our code. To do this, we need to be running the debug version of our code.
Now we get the chance to debug our project, so let's begin. First, select the configuration for development—Progeny just like we were going to run the server:
-
Then hit the green debug (bug) icon
 to the right of the green run arrow.
If you have never debugged a Rails application, RubyMine will detect that you are missing some Gems and ask if you want to install what is necessary to continue debugging. Hit the YES button and RubyMine will begin installing the gems.
Your application will now be ready to initiate a debugging session. The server is already running, but we can set a breakpoint anywhere in the Rails program to inspect what is going on at a deep level.
In the
Controllersfolder within theappfolder, open the filespecies_controller.rband set a breakpoint on the line 27. This is done by simply clicking on the line right next to the number 7 like this:
Now we need to get the application to execute this part of the code. Since this is the
Createmethod, it means that we must be in the process of creating a newSpeciesrecord in our table.Click on the New Species link in the browser or go to the link
http://localhost:3000/species/new.This brings up the form that allows you to enter the values for the table.
Enter some values such as
Humanfor the name,5618for the identification,and check the assimilated checkbox.Select the Create Species button, RubyMine will be brought to the front window and you will see a screen that looks like the following:

The bottom of the screen is divided into three panels: The stack Frames on the left, the available variables in the middle, and the Watches panel on the right.
The Frames panel lets you look at the various program threads as well as the stack frames for each thread. This can be very useful to determine the context in which your breakpoint was called.
Change the frame and go up to see which method was called before the current method. As you change frames, you will see the variables change along with it, showing you the local variables available in that particular stack frame.
Change the frame back to the
createmethod so that we can continue.The middle panel is where you can inspect variables as you step through the lines of code.
Select the little arrow next to the
paramsvariable in the center panel. It should look similar to the following screenshot:
Select the little arrow next to the
speciesvariable that is inside theparamsvariable; you will see the three variables from the HTML form that were sent to the server.Right-click on the
@speciesvariable and select the Add to Watches menu. This variable will now be shown in the Watches panel on the right.Now move through the code and let's watch this variable change.
There are five buttons that control the execution of the program in the debugger, as shown in the following screenshot:

In order from left to right they are: step over, step into, force step into, step out, and run to cursor. The most used is the step over button which we will click now. Once clicked, notice that the
@speciesinstance variable in the Watches window is no longer nil, but has a value.Open the variable in the Watches window.
Scroll down to find the
@attributesvariable and open that by clicking on the gray arrow. You will see the various properties of the actual@speciesobject that contains the same values from theparamshash that were sent to the form. These were put into place by theSpecies.newcode that we just stepped over.Notice that the
created_atandmodified_atproperties of this variable are still nil. This is because the new object that we created has not yet been saved.Click on the line 30 of the previous source file of the debugger windows which has the code:
if @species.save.Click on the debug button Run to Cursor. The program will continue executing until it gets to this line.
Now, press the button to step over and the
@species.savecommand will be executed. If the saving operation worked without error, then the program should now be on the line 31.Look at the
@speciesvariable in the Watches window and you will see that the two date properties will now be filled in with the current date and time.To continue normal operations, you can hit the green arrow on the left-hand side of the debugging windows and the program will continue to execute.
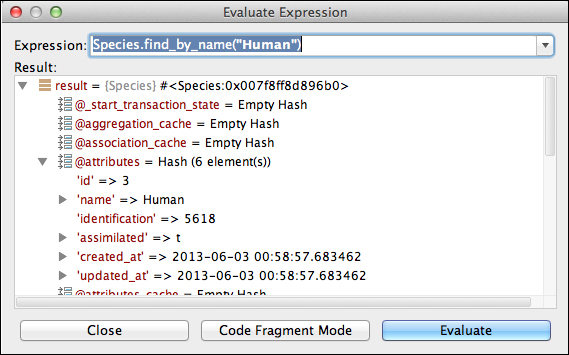
There are so many different options that we can control while debugging and too many to cover in this small book. We can even add conditions to our breakpoints. There are some other windows that we can take advantage of while debugging, which are very useful. The right-most button in the debug controls, Evaluate Expression, allows us to execute any Ruby expression and inspect variables at the same time.
Add a breakpoint to the line 7 of the species_controller.rb file and display the URL, http://localhost:3000/species. When the debugger comes to the front, hit the Evaluate Expression button. This will bring up a window that lets us add some code. Add the following code to the top input box:
Species.find_by_name("Human")Hit the Evaluate button at the bottom of the window and you should now see the results in the window, along with arrow navigation to expand and contract the various elements of this variable, as shown in the following screenshot: