

In the previous section, we created a fairly simple database report. In this section, we will modify that report to illustrate how to add images, charts, and multiple columns to a report. We will also see how to group report data. We will cover how to do all these tasks graphically with iReport.
Adding static images to a report is very simple with iReport. All that is needed is to click on the image tool icon.

Then outline the area where the image will be placed on the report. In this example, we will add a company logo to our report.
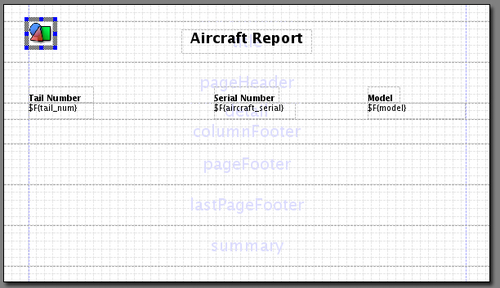
As we can see, iReport puts a placeholder image inside its outline. To enter the image expression (recall from Chapter 7 that an image expression is an expression that resolves into the location of the image, which can be a URL or a location in the file system), we double-click on the image to obtain the following window:

We can either type in the image expression or, if the image is in a local or network...