Sign In Start Free Trial
Account

Add to playlist

Create a Playlist

Modal Close icon
You need to login to use this feature.
  • Book Overview & Buying Practical Debugging for Embedded ARM Systems
  • Table Of Contents Toc
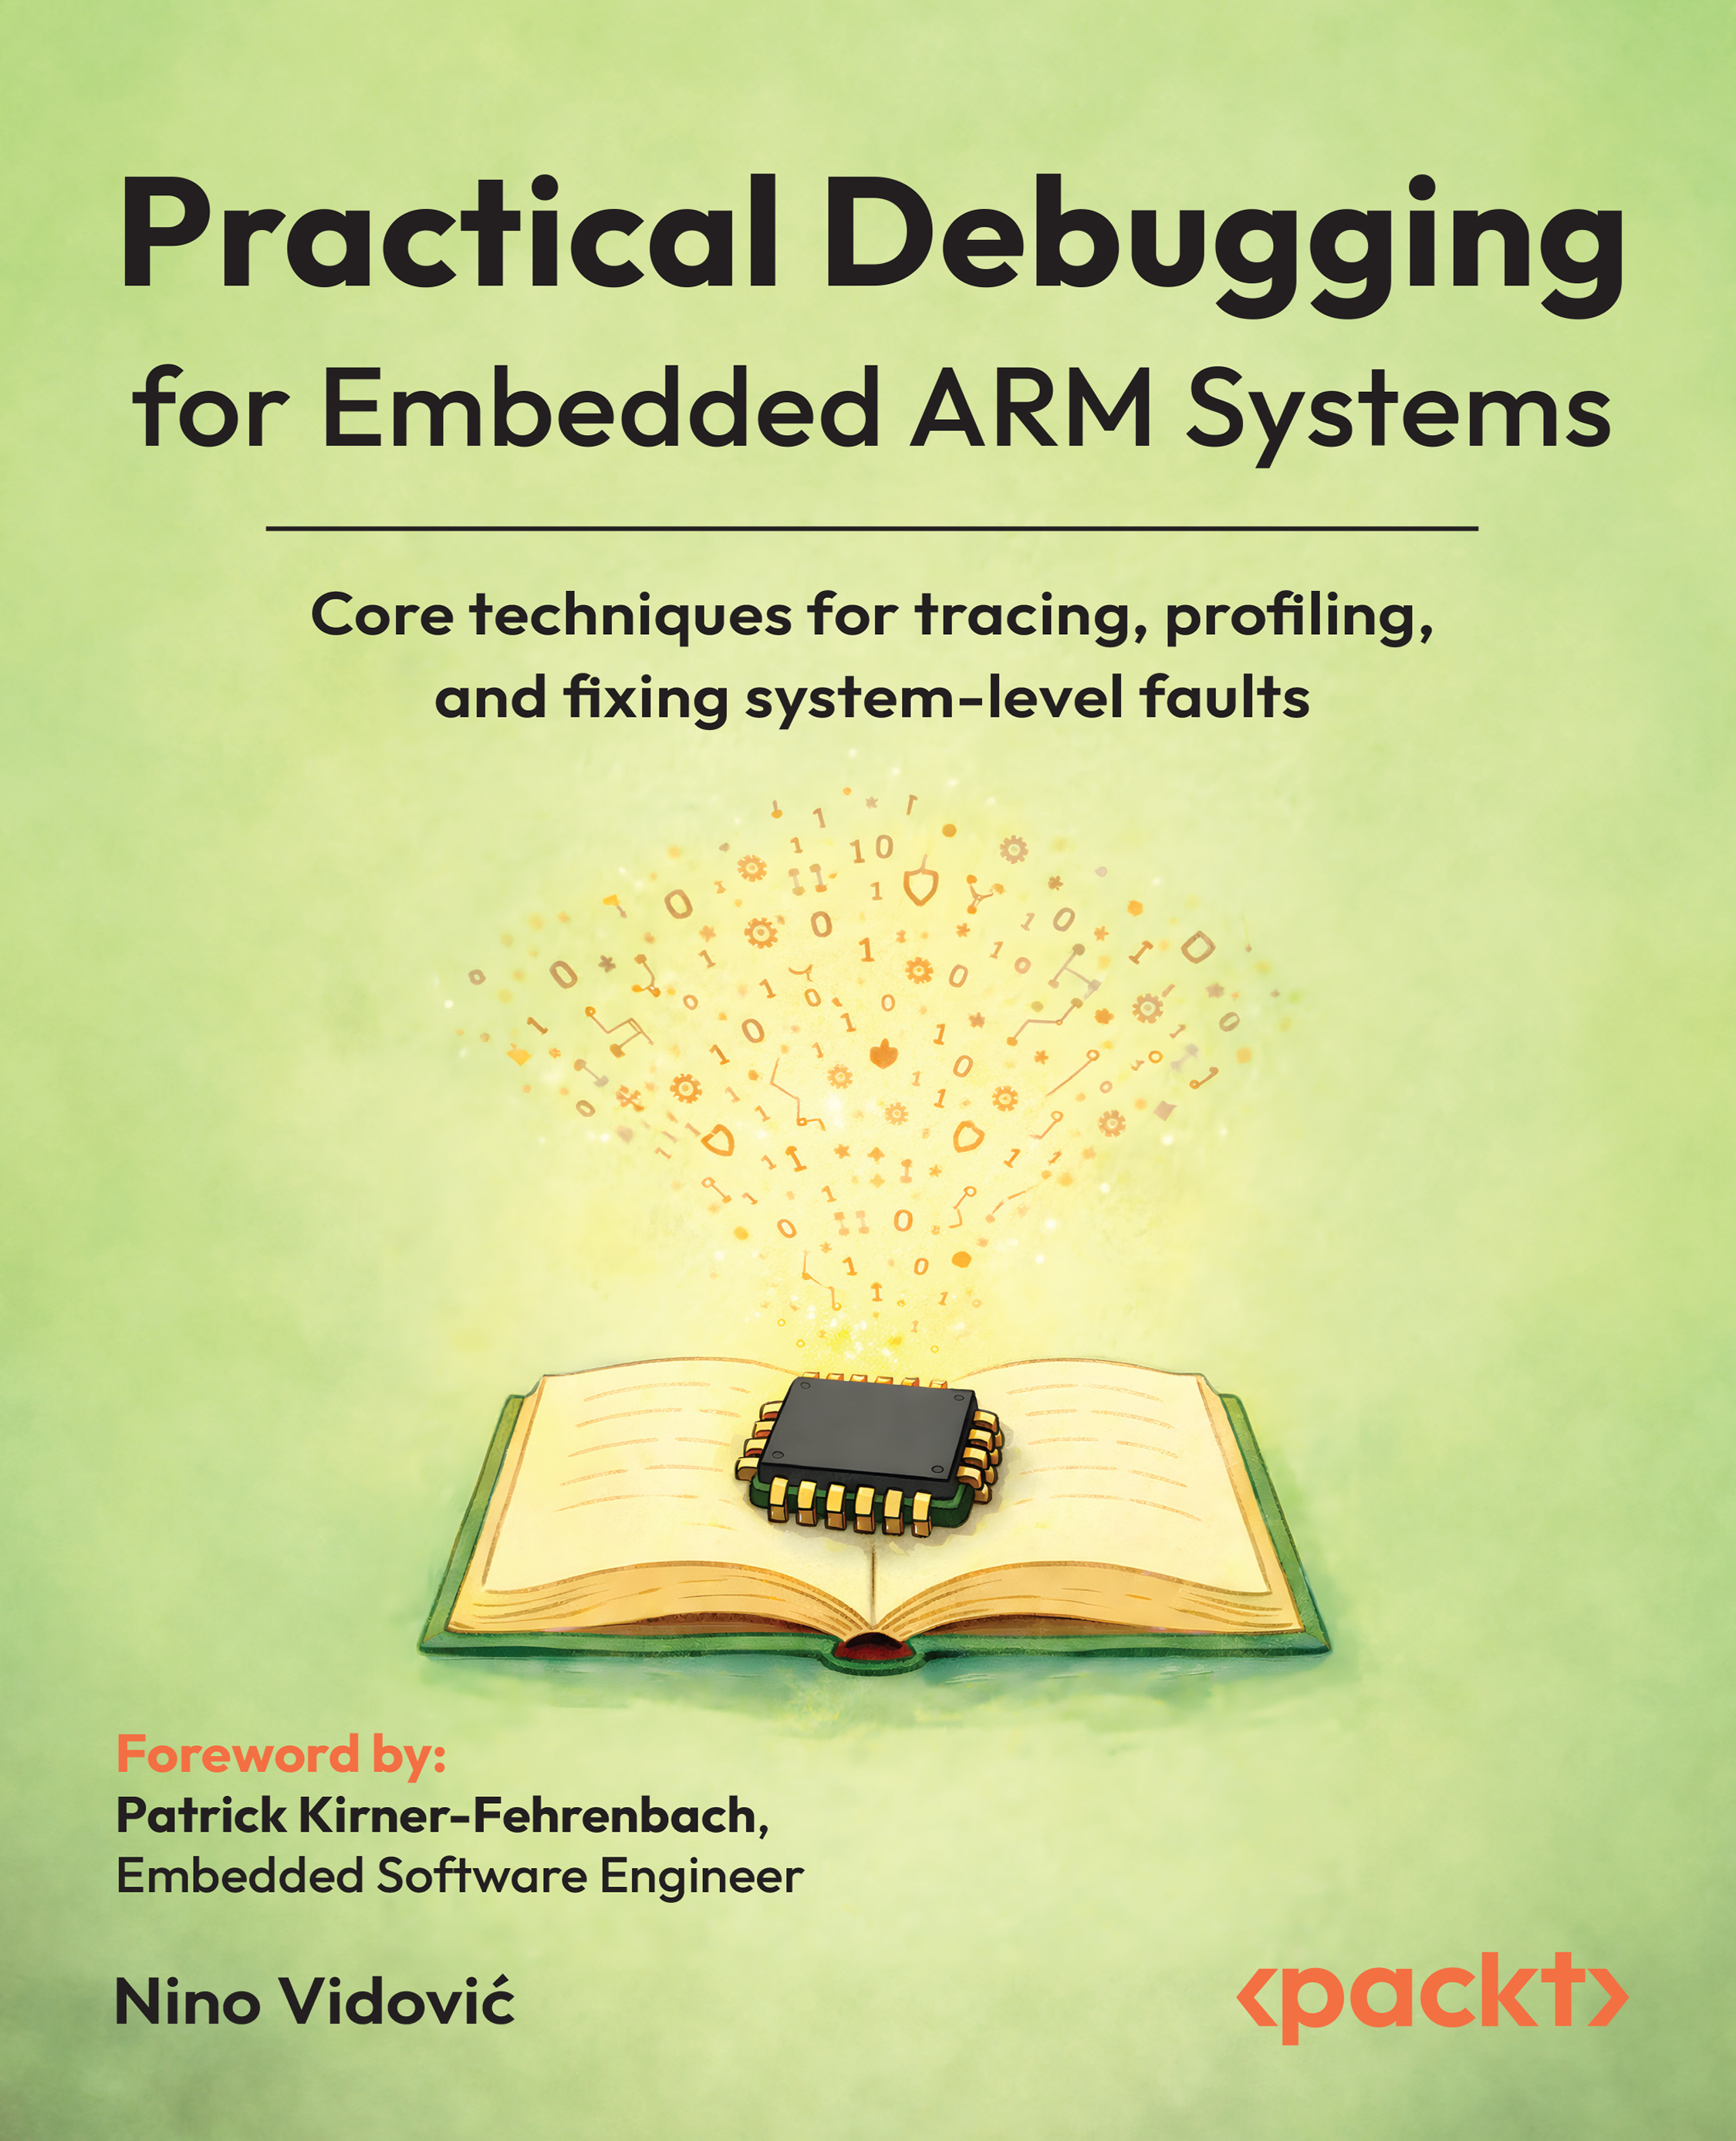
Practical Debugging for Embedded ARM Systems

Practical Debugging for Embedded ARM Systems

By : Nino Vidović
3 (2)
close
close
Practical Debugging for Embedded ARM Systems

Practical Debugging for Embedded ARM Systems

3 (2)
By: Nino Vidović

Overview of this book

Are you truly unlocking the full potential of your embedded debugging tools? This hands-on guide cuts through the confusion of common workflows and shows you how to trace, profile, and debug ARM-based systems like a professional firmware engineer. Written by an industry expert, this book guides you through practical debugging scenarios using real hardware setups. You’ll explore both essential and advanced techniques, from setting breakpoints and analyzing memory to using hardware tracing, power profiling, and RTOS awareness. Through real-world crash analysis, you'll learn how to detect stack overflows, communication errors, memory leaks, and more. You will explore practical examples based on ARM Cortex-M target devices, which help you build structured and efficient debugging workflows. The learned skills can then be easily applied to other chip architectures as well. You’ll walk away with a clear understanding of the tools available, how to apply them in complex firmware projects, and the confidence to tackle even the most elusive bugs in production systems. Whether you’re refining your setup or debugging embedded systems at scale, this book will sharpen your skills and elevate your embedded development workflow. *Email sign-up and proof of purchase required
Table of Contents (9 chapters)
close
close
7
Other Books You May Enjoy
8
Index

Breakpoints

This section will delve into the topic of breakpoints. We will learn what they are and how invaluable they are for any debug approach.

What are breakpoints?

Breakpoints are specific points in a program where code execution is intentionally stopped. This allows the developer to inspect specific code areas and verify the system's state.

They are a very valuable and flexible resource for debugging in general.

In host PC environments, we usually have an infinite number of breakpoints available to us, but as always, on embedded systems, things are a bit different. Host environments have the advantage that usually, the executed application code is fully loaded into RAM, which is volatile memory and thus easily readable and writable. When you set a breakpoint, for example, in an IDE, the debugger will replace the instruction in RAM at that position with a so-called breakpoint instruction. If the processor hits such a breakpoint instruction, it will immediately stop further code...

CONTINUE READING
83
Tech Concepts
36
Programming languages
73
Tech Tools
Icon Unlimited access to the largest independent learning library in tech of over 8,000 expert-authored tech books and videos.
Icon Innovative learning tools, including AI book assistants, code context explainers, and text-to-speech.
Icon 50+ new titles added per month and exclusive early access to books as they are being written.
Practical Debugging for Embedded ARM Systems
notes
bookmark Notes and Bookmarks search Search in title playlist Add to playlist download Download options font-size Font size

Change the font size

margin-width Margin width

Change margin width

day-mode Day/Sepia/Night Modes

Change background colour

Close icon Search
Country selected

Close icon Your notes and bookmarks

Confirmation

Modal Close icon
claim successful

Buy this book with your credits?

Modal Close icon
Are you sure you want to buy this book with one of your credits?
Close
YES, BUY

Submit Your Feedback

Modal Close icon
Modal Close icon
Modal Close icon