
In this section, the most common uses of OpenLayers will be shown. You will learn to use external mapping services as base layers for your maps, and to overlay and interact with your own data.
In the previous section, we saw how easy it is to have a basic map with a few lines of code. After creating a map object, we are able to fill it with one or more layers that can have a different nature (images and vector data) and be obtained from a plethora of sources. Here we will see how to use layers obtained as images.
In the previous section, we saw how easy it is to have a basic map with a few lines of code. After creating a map object, we are able to fill it with one or more layers that can have a different nature (raster/image and vector data) and be obtained from different kind of sources. In this paragraph, we will focus on image data provided by three of the main third-party map services: Google Maps, Microsoft Bing, and OpenStreetMap. The common feature of these services is that they give access to a set of images (tiles), served by their public web servers, which OpenLayers collects on the basis of our mapping needs (map dimensions, geographical extent, zoom level, and so on) and positions inside our map viewport.
Note
Google Maps and Microsoft Bing are commercial map services subject to license agreements that do not permit their use for profit, and their free usage is limited to a number of maximum requests per day.
Each of these map services are represented by their own layer type:
OpenLayers.Layer.Googlefor Google MapsOpenLayers.Layer.Bingfor Microsoft Bing mapsOpenLayer.Layer.OSMfor OpenStreetMap
These layers have some common features that we will briefly illustrate.
When set on a map object, they are considered by default base layers.
Base layer is an important concept to grasp because OpenLayers gives them prominent importance in managing the way the map object and the other layers work together. A base layer is positioned at the base of the layers stack as the background layer, and the map object treats it as the "leader" layer, which the other overlay layers obey. For example, the overlay layer's projection must be compatible with the base layer's projection, their geographical extent boundaries are limited by the boundaries set on the base layers, and so on. A map can have only one active base layer while many overlays can be visible at the same time.
Another common denominator for the three types of layers is that the images they refer to maps are projected through a Web Mercator projection, also called as Spherical Mercator, because it treats coordinates as if they were spherical, to simplify computational costs. This is a planar projection, specifically developed for the purposes of World Wide Web mapping services, popularly identified by the code EPSG:900913, extending -180° to 180° W-E, and 85.05113 S and 85.05113 N. These extents allow to visualize a good portion of the Earth with two square images horizontally aligned.
Note
The European Petroleum Survey Group (ESPG) registry is a public dataset of Coordinate Reference Systems. EPSG:900913 is not an official code. It was invented by Google, and the number is a graphical trick where numbers resemble the corporate name. The Spherical Mercator projection was accepted later by EPSG and was assigned the code EPSG:3857.
In the Quick start example we wrote the following piece of code:
map.setCenter(
  new OpenLayers.LonLat(10.50, 45.00).transform(
    new OpenLayers.Projection("EPSG:4326"),
    new OpenLayers.Projection("EPSG:900913")
  ),5
);
Why do we need to transform our lat/lon? If you notice we never said that our map has a EPSG:900913 projection. This follows from the two previous features. The OSM layer is a base layer, so it wants us and the map to consider it as the leader and behave accordingly. Whenever we act on the map, for example, move it, zoom it, click on it, or overlay other layers, we need to obey the base layer's requirements. In this case, we wanted to move the map to a certain position, given in EPSG:4326 lat/lon coordinates, but OSM layer's projection is EPSG:900913. Never try to have words with a base layer. Instead, transform your coordinates as it wishes, and you will get on well with it!
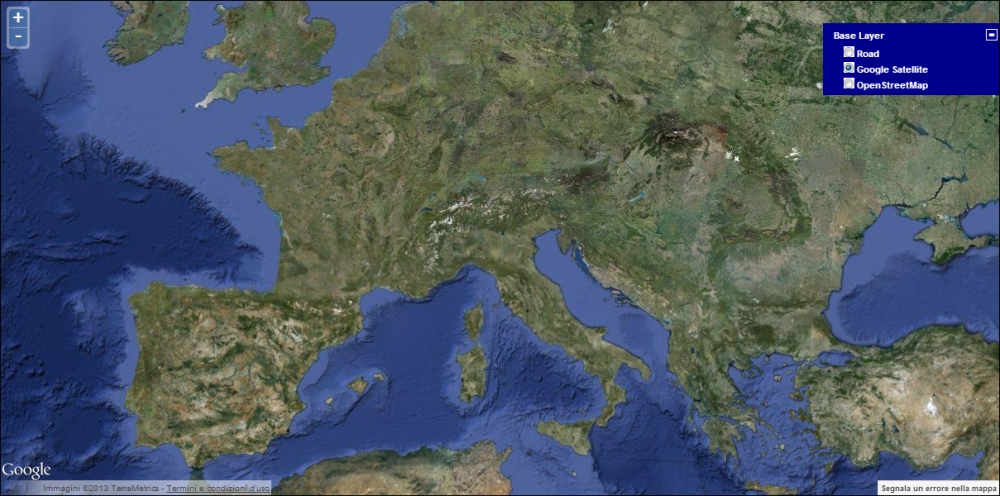
Back to the three layers. Let's see how to set up a Google Map layer. I will add this layer to the map before the OSM layer we set in the previous example.
Copy
recipe_02.htmlto a new file and name itrecipe_01.html.Right before the OpenLayers script, add the script for the Google Maps API.This is required to enable OpenLayers to converse with the Google Map service.
<script src="http://maps.google.com/maps/api/js?v=3&sensor=false"></script>
Create the Google Maps layer:
var gs = new OpenLayers.Layer.Google( "Google Satellite", {type: google.maps.MapTypeId.SATELLITE, numZoomLevels: 22 );Add the layer to the map before adding the OSM layer:
map.addLayer(gs);
Expanding the layer switcher, you will be able to change the active base layer. Notice that layer stacking follows the order inside the array used in map.addLayers().
As you will notice, we had to provide some more information compared to the OSM layer. Options are always passed to the layer as a JavaScript literal object (which is defined within curly brackets). In this case we are using two options:
type: In the context of a Google Maps layer, we use it to define which kind of Google Maps layer we want to use. These are defined by the Google Maps APIs and includegoogle.maps.mapTypeId(SATELLITE,ROADMAP,TERRAIN, andHYBRID). They will sound familiar, they're the same as you can switch when navigating tomaps.google.comand related services.numZoomLevels: This option defines how many zooming levels your map will provide, for example, how much you can zoom in and out, starting from the first zooming level (completely zoomed out). Google Maps ranges from 19 to 22, depending on the type of layer and the geographical zone (some areas have more detailed maps than others), while OSM provides 19 zooming levels.
Note
Zooming is strictly related to map resolution. Zooming levels start from 0, the outmost zoom that can be used on the map. If not otherwise specified, it corresponds to the highest resolution of the layer. The Web Mercator projection uses a spherical model of the Earth whose diameter is about 40075016.68 m, and the services we're treating splits the global map in squared images (tiles) with a 256 px side. Consequently, the zooming level 0 has a resolution of 156543.033906 m/px (40075016.68/256). Each next level is obtained by dividing this value by 2^zoomLevel.
And what about Bing? Simply do the same as for OSM and Google Maps, create the respective layer, and add it to the map.
var road = new OpenLayers.Layer.Bing({
                name: "Road",
                key: apiKey,
                type: "Road"
            });
The type option is similar to the Google Maps layer. In this case we can use Road, Aerial, and AerialWithLabels. We have one more specific option, key. This is a string that you must obtain from the Bing web portal, to be able to use their Map API.
A final note! Instead of adding the layers one by one, we can group them in one single call to map.addLayers, passing an array with our layers. The first layer will be the default one.
map.addLayers([gs,osm,bing]);
Many of you will probably know or have heard about OGC services, WMS and WFS in particular. They are two of the most widely used web map services standards created by the Open Geospatial Consortium (OGC), an international consortium of about 400 companies, government agencies, and universities, which develops public standards in the field of geographical and location-based information systems.
First we'll see WMS services, which stands for Web Mapping Service. WMS defines a common language to interact between applications and web services to exchange rendered maps in the form of images. The Google Maps service also provides the means to access a repository of maps as images, but it doesn't follow a standard protocol standard interface.
Note
You can set up your own WMS server. Geoserver and Mapserver are two free map servers which can serve both WMS and WFS services. You can find more information on them on their respective websites. Both of them can also be reached through the open source Geospatial Foundation portal, www.osgeo.org.
OpenLayers provides the OpenLayers.Layer.WMS layer type. We will use it to load a thematic geological map of California (USA), published by the United States Geological Survey (USGS) map servers. Let's start our new example.
Create a new file,
recipe_03.htmlas a copy fromrecipe_01.html.Define two WMS layers.
var california_litho_lo = new OpenLayers.Layer.WMS(
"California litholohical lo-res map (USGS)", "http://mrdata.usgs.gov/services/ca",
{layers:"lith-low",transparent:true},
{isBaseLayer:false,projection:"EPSG:900913",maxScale:2370000});

var california_litho_hi = new OpenLayers.Layer.WMS(
"California litholohical hi-res map (USGS)",
"http://mrdata.usgs.gov/services/ca",
{layers:"lith-high",transparent:true},
{isBaseLayer:false,projection:"EPSG:900913",minScale:2370000,opacity:0.5}
);
The first parameter to an
OpenLayers.Layer.WMSis, as usual, the name we want to assign to this layer.The second one is the URL of the WMS server where our map resides.
The third parameter is an object containing the WMS request options, and must contain at least the name of one map (
layer) that we want the WMS to serve for. We have added another option to ask the server to supply an image withtransparencyapplied on it (null values from the original map layer will make the maps appear transparent, otherwise they will be rendered white).Note
Under the hood, OpenLayers asks for a map issuing a
GetMaprequest to the WMS server. The complete list of the parameters that can be defined for this type of request are specified by the WMS standard, which is publicly available on the OGC website, http://www.opengeospatial.org/standards/wms.In the OpenLayers's layer options, we have set the projection to be Spherical Mercator, to be compatible with the Google base layer. OpenLayers will ask the WMS server to give back the map projected according to this CRS.
In the fourth parameter, we set the layer options.
isBaseLayeris set tofalsebecause we want the layer to be shown as an overlay, layered above the base layer. If we didn't set this variable, it would be considered a base layer and we couldn't see it overlayed because, as we said before, only one base layer can be visible at the same time. Finally a scale-related option is used. The two layers should be used alternatively at different scales. The one with low resolution should be used until 1:2370000, then it will be switched off and the one with high resolution will appear. For the high-resolution layer, we also set the layer opacity to 0.5, to make it partially transparent.Note
We can find all of the information about the available layers, such as CRS and scale constraints (and much more information about the service itself) by issuing a GetCapabilites request as
http://mrdata.usgs.gov/services/ca?request=getcapabilities&service=WMS&version=1.1.1.We will obtain an XML response where all of the required information can be retrieved.
Add the WMS layers to the map:
map.addLayers([gs,california_litho_lo,california_litho_hi]);
Center the map to an appropriate extent (you can obtain it from the aforementioned
GetCapabilitesrequest), which creates anOpenLayers.Bounds, which represents a rectangular region defined by the lower left corner (minX, minY) and the upper left corner (maxX, maxY) coordinates:var bounds = new OpenLayers.Bounds(-125.322,32.4715,-114.205,42.0089).transform( new OpenLayers.Projection("EPSG:4326"), new OpenLayers.Projection("EPSG:900913")); map.zoomToExtent(bounds);To prevent the user from panning beyond the defined extent, we can set the
map.restrictedExtentproperty to theboundsobject (notice that it could be set directly as an option when defining themapobject):map.restrictedExtent = bounds;

The OGC WMS specification defines the GetFeatureInfo method to obtain information about the features rendered on the map, for example, data attributes. If the layer has the queryable attribute set to 1 inside the GetCapabilites response, it means you can send a GetFeatureInfo request on it.
The OpenLayers.Control.WMSGetFeatureInfo object is what we require to perform the request. We will talk about controls later, at this moment it's enough to say that they are objects that let the user interact with the map.
Create a new file
recipe_04.htmlas a copy ofrecipe_02.html. After the layers' definitions, create the control object:var getFeatureInfo = new OpenLayers.Control.WMSGetFeatureInfo({ url: 'http://mrdata.usgs.gov/services/ca', layers: [california_litho_high, california_litho_high], queryVisible:True, infoFormat: text/plain });The URL is the same as the WMS layer, because we are querying the same WMS server.
In layers, we set the array of map layers from which we want to obtain information.
queryVisibleset toTruemeans that we want to perform theGetFeatureInforequest only for the layers that are actually visible. In our case, we will obtain information for one layer or the other depending on the actual scale of the map.infoFormatdefines the format of the response we want the server to give us back. It is coded as a MIME type, and they are listed in theGetCapabilitiesresponse. Typical formats aretext/htmlfor an HTML response,application/vnd.ogc.gmlfor GML, andtext/plainfor simple text. We will use the simpler one,text.
We define a function that will manage the response from the server. We will simply fire a JavaScript
alert()to open an information box:function showInfo(response){ alert(response.text); }When the control receive a responses from the server, it will signal it to the application by launching a signal, the
getfeatureinfoevent. We want to intercept it and launch the function defined in the previous step:getFeatureInfo.events.register('getfeatureinfo',this,showInfo);Let's add the control to the map. We also need to activate it to make it react to the mouse clicks:
map.addControl(getFeatureInfo);
getFeatureInfo.activate();

Notice that GetFeatureInfo will perform a cross-domain request. We need to set up proxy.cgi, as explained earlier in this book, and populate the OpenLayers.Proxy property, otherwise no response will be received.
OpenLayers.ProxyHost = "/cgi-bin/proxy.cgi?url=";
function initMap(){
  (…)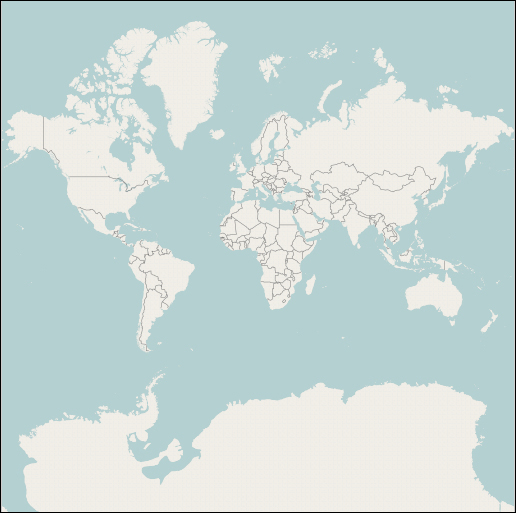
}The three map providers we used in recipre_01_gio.html share a common trait; they all serve the images as a set of tiles of fixed dimension, 256 px wide and 256 px high, each one reachable through its own URL (for example, http://a.tile.openstreetmap.org/0/0/0.png). These are, generally, prerendered images kept in a cache to avoid live map rendering. OpenLayers will do several requests to obtain the set of images, which finally will be composed in a continuous, single layer. Tiles are organized in a hierarchical structure, such as a filesystem. Every zooming level (the folder in the filesystem metaphor) has its own set of tiles (the single files), laid in a grid shape where each tile occupies a cell. The tile dimensions are always the same, but starting at minimum zooming level the whole world will be contained in a single tile (refer to the following screenshot), while at the maximum zooming level you may need over a billion tiles to obtain a single image of the earth!
While Google, Bing, and many other commercial services use their own tile scheme, various standards have been developed to define a common scheme, such as WMST from OGC, TMS, WMS-C. Here we will use OpenLayer.Layer.XYZ, which provides a generic, configurable scheme. The names recall the tile coordinates; z is the zooming level, and x and y are the coordinates in the grid of tiles for that zooming level.
Note
Beyond public web services such as OpenStreetMap and MapBox, you can use your own map server to publish maps in this fashion. MapProxy and TileStache, for example, are specifically designed to cache and serve tiled maps. Mapserver and Geoserver can also be configured to do this.
Let's see how to load an XYZ layer from a map published through MapBox. Here we will use a base layer, offered out of the box by MapBox, whose source comes from the NaturalEarth public domain dataset.
Create
recipe_05.htmlfromrecipe_01.html. We will only have our new kind of layer, so we can remove the OSM one. Let's define theXYZlayer.var earth = new OpenLayers.Layer.XYZ( "Natural Earth", ["http://a.tiles.mapbox.com/v3/mapbox.natural-earth-hypso-bathy/${z}/${x}/${y}.png"], { attribution: "Tiles © MapBox", sphericalMercator: true, wrapDateLine: true, numZoomLevels: 19 } );The second parameter is an array of URL templates. If multiple URLs are set, OpenLayers will distribute the requests between them, to take advantage of the multiple servers available to collect tiles.
Each URL is a template. This will be used by OpenLayers to craft the request, depending on the tile it requires. If we are viewing the whole Earth from the minimum zooming level, OpenLayers will substitute the variables with
z=0,x=0, andy=0.A template is used because a service could expose a different scheme, for example, with the zooming level of the latter block of the URL (
x/y/z).The third parameter is the usual layer option's object. This time we also set an attribution to be shown on the map, and switch on the
wrapDateLine, which will let us pan in east-west directions indefinitely, passing through the Date Time line (Pacific Ocean), as if we were spinning a globe.
Add the layer to the map as usual and center it on China (lon: 110, lat: 35), to a zooming level 4.
To highlight the fact that the map is a composition of a set of square images, 256 px x 256 px, we can add a CSS style class to the <style> element of our page, which will override the default one that OpenLayers applies to each tile image and will apply a red border to the tiles.
.olTileImage{ border: 1px solid red; }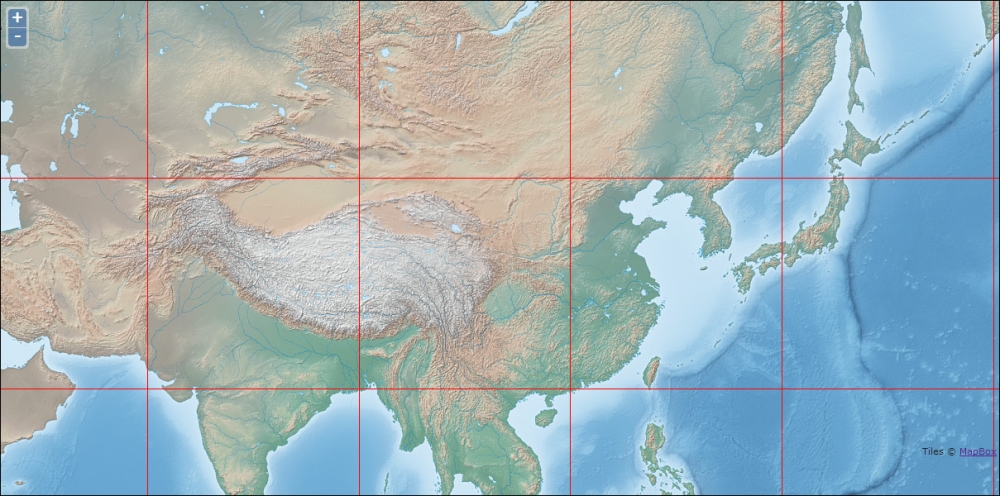
So far we have overlooked the explanation of the map.addControl method. We have used it in all our examples and it's time to spend some time on it. It adds OpenLayers.Control to the map. There are several kinds of controls available in OpenLayers, which can be roughly subdivided in two broad classes; those that permit you to interact with the map (panning, zooming, selecting features, and so on) and those which provide map widgets and visual information feedback. Here we will only see some of them.
The following basic interaction controls are probably the most widely used:
OpenLayers.Control.Zoom: Themapobject uses this control by default. It's the GUI control used to zoom in or zoom out, positioned at top left in the map viewport.OpenLayers.Control.PanZoomBar: This is similar to the zooming control, but it provides visual controls to pan and a slider to step between the zooming levels. In case you want to use this, you should replace the zooming control, because it has the same default position and the two would get overlapped.OpenLayers.Control.KeyboardDefaults: Pans the map with the keyboard arrows.OpenLayers.Control.MousePosition: This stays between interaction and visual control, as it will show geographical coordinates of the current mouse position. The coordinate CRS is the same as the map, but it can be changed by setting thedisplayProjectionoption on the map:var map = new OpenLayers.Map( "map",{displayProjection:'EPSG:4326'});
Let's see some visual controls now:
OpenLayers.Control.LayerSwitcher: This is the only control that we have explicitly used until now. This is the visual widget that shows the layers in the map and lets us switch them on/off.
OpenLayers.Control.OverviewMap: A small map will be added at the bottom right of the viewport to show an overview of the current position and extent. By default, it will be a clone of the main map, otherwise we can set specific options and layers for the overview. We could add an overview with the OSM layer only.OpenLayers.Control.ScaleLine: A scale bar will be drawn on the map.OpenLayers.Control.Permalink: This will provide a URL that you can share to let other users land in the same position and zooming level as the current map.
In addition to zoom, another control is added by default to the map object, the OpenLayers.Control.Navigation. It doesn't have a GUI component, but it provides the invisible mechanism to click-and-drag the map and zoom with the mouse wheel.
Back to our map! We want to enrich it with an overview map, substitute the zoom control with the panzoom control, and add a scale bar.
Starting from
recipe_03.html, createrecipe_06.html. Controls can be set in one shot during the map creation. We override the default control's array, because we don't want the zoom control to be added. We keep the navigation instead and add the scale bar and the panzoom control. We also set theLayerSwitcherhere instead of usingmap.addControl.var map = new OpenLayers.Map( "map",{ controls: [ new OpenLayers.Control.Navigation(), new OpenLayers.Control.PanZoomBar(), new OpenLayers.Control.ScaleLine(), new OpenLayers.Control.LayerSwitcher() ] });Finally, let's create an overview map (which we want maximized when we open the page) with just the OpenStreetMap layer. Instead of creating a brand new OSM layer, we can clone it from the one we already have. Pay attention to not assign the previous OSM layer to a new variable without cloning it!
var osm2 = osm.clone();
var overlayOptions = {
  maximized: true,
  layers: [osm2]
};
map.addControl(new OpenLayers.Control.OverviewMap(overlayOptions));
This gives a change to the look. Let's rearrange the layer's array in the
map.addLayerscall to set the Bing Maps layer as the default base layer:map.addLayers([bingroad,gs,osm,california_litho_lo,california_litho_hi]);

Technically and in general, a vector layer is an object composed by an array of features, and every feature is an object containing a geometry and an array of attributes.
Vector layers are client side, so once data is downloaded and rendered in your browser, there's no need to send new requests to the server to retrieve information. This characteristic permits a real-time interaction with the features on top of the map, but on the other side, you must be careful in managing large datasets such as vector layers, because they can really slow down things and make your map unusable and unattractive.
With vector layers, we can also create mash-ups, that is, web applications integrating data from external resources and services. An important thing to be aware of is that when we want to populate a vector layer for retrieving information from external web resources, we need to perform cross-domain requests. To be able to retrieve data, we must have set up proxy.cgi, as explained earlier in this book.
A vector layer can be added to the map from a variety of sources, as files and web services. In this example, we will see how to create a vector layer based on a GeoJSON file stored on a local folder. Let's go!
First of all, take the
states.geojsonfile from the book's code bundle and copy it in youropenlayers_starterfolder.
The following illustration shows the attributes' structure:

This file is a feature collection containing data about the occurrences of earthquakes in the US during the last 30 years. We created this dataset for didactic purpose using information available on the USGS website.
Copy
recipe_01.htmlto a new file and name itrecipe_07.html.Set the center of the map to United States by changing the coordinates and the zooming level used for the previous recipes.
map.setCenter(
new OpenLayers.LonLat(-111.42387,52.41521).transform(
		new OpenLayers.Projection("EPSG:4326"),
	   	new OpenLayers.Projection("EPSG:900913")
), 3
);
Just below the OpenStreetMap base layer object code, insert the following lines to create and add the vector overlay on top of the map:
var states = new OpenLayers.Layer.Vector("Earthquakes30",{
  protocol: new OpenLayers.Protocol.HTTP({
    url: "../states.geojson",
    format: new OpenLayers.Format.GeoJSON()
  }),
  strategies: [new OpenLayers.Strategy.Fixed()]
});
map.addLayer(states);
Let's explain what happened:
We instantiated a new type of layer object, the vector layer. Its constructor, in our snippet, takes the
"Earthquakes 30"string and two optional parameters between the curly brackets ({}),protocolandstrategies.The
protocolparameter takes care of retrieving the data from the source (in this case, it is the GeoJSON file). Theurland theformatoptions respectively specify the data source path and its type.The
strategiesparameter expects an array of strategy objects that specifies how OpenLayers requests the data. TheFixedstrategy is a simple strategy that requests features once and never requests new data. We will see other types of strategies in the next paragraphs.
When talking about image-based layers, we have seen the OGC WMS standard. A closely related standard is OGC WFS, which stands for Web Feature Service. Unlike WMS, it defines a protocol to exchange vector data. We will see OpenLayers.Protocol.WFS in action to load a geological layer from the Arizona Geological Survey and overlay it on a Google Maps Satellite base.
The WFS service GetCapabilities response lists only one supported CRS, EPSG: 26912. OpenLayers isn't shipped with all of the information and mechanisms to manage the whole range of CRS on the Earth. We have seen that it can transform EPSG:4326 coordinates to EPSG:900913, because they're included by default, but how will we overlay EPSG:26912 geometries on a Google Maps base, which is EPSG:900913?
An external library that helps in this case is Proj4js. It is the JavaScript port of a powerful library, Proj4, dedicated to CRS transformations and reprojections. Proj4js isn't shipped with OpenLayers, but it can cooperate when the former is loaded in our page. We need to download it first from http://trac.osgeo.org/proj4js/wiki/Download (the present version is proj4js-1.1.0.zip) and extract it inside our web server in the OpenLayers-2.12 folder.
Let's start our new example.
Start
recipe_08.htmlfromrecipe_02.htmland let's include theProj4jslibrary before the OpenLayers library.<script src="../proj4js/lib/proj4js-compressed.js"></script> <script src="../OpenLayers-2.12/lib/OpenLayers.js"></script>
Remove OSM and Bing layers. We will keep a Google Maps layer of the type
SATELLITE.Now comes the more complicated part, to make
Proj4jsaware of the CRS we need to use. At the very beginning of our script, let's define the CRS as follows:Proj4js.defs["EPSG:26912"] = "+proj=utm +zone=12 +ellps=GRS80 +datum=NAD83 +units=m +no_defs";
What is that? We can't give the details of what that string means, it's beyond the scope of this book, but it is sufficient to say that it's the way to define a CRS in
Proj4, and inProj4jsas a consequence. This particular string represents the EPSG:26912 reference system.Note
The
Proj4syntax documentation can be found on theProj4project's site, http://trac.osgeo.org/proj/. You can obtain theProj4strings for all of the EPSG CRSs from the Spatial Reference website, http://spatialreference.org/. As an example, theProj4definition for EPSG:26912 can be found at http://spatialreference.org/ref/epsg/26912/.
OpenLayers will now be able to transform the coordinates to EPSG:900913 coordinates, so we can superimpose the vectors on OSM, Google Maps, Bing, and so on.
Back to WFS.
Let's create the WFS layer representing the railway stations of England.
var arizona_geology = new OpenLayers.Layer.Vector("WFS", {
  strategies: [new OpenLayers.Strategy.BBOX()],
  protocol: new OpenLayers.Protocol.WFS({
    url: "http://services.azgs.az.gov/ArcGIS/
    services/GeologicMapOfArizona/MapServer/WFSServer",
    featureType: "Contacts_and_Faults",
    featurePrefix: "GeologicMapOfArizona",
    featureNS:
    "http:///GeologicMapOfArizona/MapServer/WFSServer",
    geometryName: "Shape",
  }),
  projection: new OpenLayers.Projection("EPSG:26912"),
  styleMap: contacts_and_faults
})
The fundamental protocol options are
urlandfeatureType, which is the layer we are asking for (the WFS standard names ittypeName).From
GetCapabilities, we know that the layer name is prefixed by a namespace, that is,GeologicMapOfArizona:Contacts_and_Faults. We addfeaturePrefixto compose the correcttypeName. Then we addfeatureNS, which is the URI of the feature namespace andgeometryName, that is, the name of the geometry column of the data source. These two values can be obtained from aDescribeFeatureTyperequest to the WFS server.Finally, we define the projection of the layer. It's required to make OpenLayers aware that the returned geometries have coordinates according to this CRS.
In this example, we are using two new elements,
OpenLayers.Strategy.BBOXand astyleMapparameter (which is defined in the source code of this example). They will be introduced later, but in a few words, the first makes OpenLayers download only the data for the actual extent of the map and the latter is used to define styling options for the layer.Add the layers to the map, centralize the map on the city of Phoenix, and set the zooming level at 11.
map.addLayers([osm,os]);
var center = new OpenLayers.LonLat(-112.073889,33.448333).transform(
  new OpenLayers.Projection("EPSG:4326"),
  new OpenLayers.Projection("EPSG:900913"));
map.setCenter(center,11);
The GeoRSS is an OCG standard file format for encoding location as part of a web feed. It would be interesting to use the mash-up approach, because, for example, a GeoRSS source can also be read by common news aggregators (as a normal RSS). An idea would be to use this kind of data source to build a web mapping application that shows a map view and a list of news in the same page. Explaining how to retrieve web feeds in your page is beyond the scope of this book, but there are a bunch of alternatives to accomplish this task (take a look at jFeed, a plugin for the super popular jQuery framework).
There are two encodings for GeoRSS:
GeoRSS Simple: Supports basic geometries
GeoRSS GML (Geography Markup Language): Supports a greater range of features than the GeoRSS Simple encoding and coordinate reference systems other than WGS84 latitude/longitude
After this brief introduction, let's prepare our GeoRSS example. In the paragraph about the proxy installation, we added the USGS domain to retrieve remote data from it. In this example, you will learn how to add a GeoRSS source as a vector layer to your map by using the public real-time data that USGS exposes. In our example, we will use GeoRSS Simple for Atom files (available at http://earthquake.usgs.gov/earthquakes/feed/).
Create a new HTML template, as already shown in the Quick start section, and name it
recipe_09.html.Define your
initMapfunction as usual, inside thescripttag. This time the initialization function has to be preceded by theOpenLayers.ProxyHostvariable referencing the proxy script on your server:<script > OpenLayers.ProxyHost = "/cgi-bin/proxy.cgi?url="; function initMap(){ } </script>Add a
mapobject and a base map:var map = new OpenLayers.Map("map"); var osm = new OpenLayers.Layer.OSM("OSM Base Map") map.addLayer(osm);Define and add your GeoRSS-based vector overlay object as follows:
var earthquakes = new OpenLayers.Layer.Vector("USGS Feed",{
  protocol: new OpenLayers.Protocol.HTTP({
    url: "http://earthquake.usgs.gov/earthquakes/
    feed/atom/2.5/month",
    format: new OpenLayers.Format.GeoRSS()
  }),
  strategies: [new OpenLayers.Strategy.Fixed()]
});
map.addLayer(earthquakes);
As you can see, only the
urlandformatparameters change compared to the GeoJSON example.The source in
urlis, obviously, a GeoRSS and the shared real-time data. In this case, consider earthquakes events with a minimum magnitude of 2.5 over the 30 days.Fly to Japan!
map.setCenter(
  new OpenLayers.LonLat().transform(
    new OpenLayers.Projection("EPSG:4326"),
    new OpenLayers.Projection("EPSG:900913")
  ), 5
);
An important aspect of GIS is its interactivity, that is, the ability to retrieve information about the elements populating a map. This is true also for web mapping applications and users who, typically, approach them expecting something to happen even before knowing what they are looking for!
OpenLayers provides you with an effective way to build interactivity, and in this example, we will see how to use the selection control and popups to retrieve and show information.
Make a copy of the
recipe_10.htmlfile and name itrecipe_10.html.Create the selection control below the
map.addLayer(states)line:var select = new OpenLayers.Control.SelectFeature(states,{ multiple: false }); map.addControl(select); select.activate();Using this code, you add the possibility to select the polygon features of your vector layer (states) by clicking on them. The
multiple:falseoption establishes that only one polygon at a time can be selected and the lineselControl.activate(), of course, makes the new control active and enables it to listen for mouse click events.Add the functions
onSelectandonUnselectto the control constructor:var select = new OpenLayers.Control.SelectFeature(states,{ multiple: false, onSelect: function(feature) {}, onUnselect: function(feature) {} });Fill in the new functions:
var select = new OpenLayers.Control.SelectFeature(states,{
  multiple: false,
  onSelect: function(feature) {
    // Prepare the popup content
    var content = feature.attributes.state_name +": "
    + feature.attributes.e_quakes
    + "Earthquakes in the last 30 years";
    // Create a popup object
    var myPopup = new OpenLayers.Popup.FramedCloud(
      feature.id+"_popup",
      feature.geometry.getBounds().getCenterLonLat(),
      new OpenLayers.Size(150,100),
      content
    );
    // Link the popup to feature and add it to the map
    feature.popup = myPopup;
    map.addPopup(myPopup);
  },
  onUnselect: function(feature) {
    // Remove the popup from map
    map.removePopup(feature.popup);
  }
});
Here's what happens:
The
onSelectfunction runs when an element on the map is selected and takes thefeatureargument, between round brackets, representing the selected feature object.The feature object contains the geometry and the attributes. We retrieve the values in
attributes.state_nameandattributes.e_quakesfor the selected feature and store them into thecontentvariable.The variable called
myPopupcontains the pop-up object. The arguments passed to theOpenLayers.Popup.FramedCloudsubclass constructor include the ID, a string that identifies the specific pop-up, the location where the pop-up must appear, the pop-up size in pixels, and ourcontentvariable with the information in the form of an HTML string.The last two lines inside the
onSelectfunction relate the pop-up to the current feature, and finally, display it on the map.The
onUnselectfunction is executed when a feature is unselected. The argument is the unselected feature and it is passed to theremovePopupfunction.
In this section, you will learn how to create a thematic map by using the OpenLayers styling capabilities.
Note
A thematic map focuses on a specific theme or subject area, whereas in a general map the variety of phenomena—such as geological, geographical, and political—regularly appear together. The contrast between them lies in the fact that thematic maps use the base data, such as coastlines, boundaries, and places, only as points of reference for the phenomenon being mapped.
First of all, we will use the StyleMap and Style classes to customize the graphic appearance of the features.
Make a copy of the
recipe_09.htmlfile and name itrecipe_11.html.Define the
myStylevariable just before the state vector layer definition to create aStyleobject. It consists of a symbolizer with akey:valuepair, similar to CSS:var myStyle = new OpenLayers.Style({ fillColor: '#CC3333', fillOpacity: .75, strokeColor: '#FFF', strokeWidth: 2 });Modify the definition of the state vector layer by adding a
styleMapobject to apply the symbolizer, and define the default layer style:var states = new OpenLayers.Layer.Vector("Earthquakes30",{ protocol: new OpenLayers.Protocol.HTTP({ url: "../states.geojson", format: new OpenLayers.Format.GeoJSON() }), strategies: [new OpenLayers.Strategy.Fixed()], styleMap: new OpenLayers.StyleMap({ 'default': myStyle }) });
What we've just seen is a very basic styling example, but obviously we can do much more. In the next example, thanks to the Rule and Filter classes, we will explain how to style features depending on the values stored into their attributes:
Make a copy of the
recipe_11.htmland name itrecipe_12.html.Let's define some rules just before the
myStyleobject:// match e_quakes values equal to 0 var equalTo_rule = new OpenLayers.Rule({ filter: new OpenLayers.Filter.Comparison({ type: OpenLayers.Filter.Comparison.EQUAL_TO, property: 'e_quakes', value: 0 }), symbolizer: { fillColor:'#CCC' } }); // match e_quakes values between 1 and 10 var between_rule = new OpenLayers.Rule({ filter: new OpenLayers.Filter.Comparison({ type: OpenLayers.Filter.Comparison.BETWEEN, property: 'e_quakes', lowerBoundary: 1, upperBoundary: 10 }), symbolizer: { fillColor: '#F60' } }); // match e_quakes values greater than 10 var greaterThan_rule = new OpenLayers.Rule({ filter: new OpenLayers.Filter.Comparison({ type: OpenLayers.Filter.Comparison.GREATER_THAN, property: 'e_quakes', value: 10 }), symbolizer: { fillColor: '#FF0000' } });Each rule consists of:
filterused to specify a conditionsymbolizerthat applies certain graphic properties if the specified condition occurs
In particular, in this example, we have three comparison filters looking for the values stored in the
e_quakesattribute of the states vector layer. When the current value isEQUAL_TO,BETWEEN, orGREATER_THAN, the value expected by the filter, the consistent symbolizer is used, and the feature is styled subsequently.Now that you have a group of rules, the last step is adding them to your original
myStyleobject as an array:var myStyle = new OpenLayers.Style({ fillColor: '#CC3333', fillOpacity: .75, strokeColor: '#FFF', strokeWidth: 2 },{ // Apply rules rules:[ equalTo_rule, between_rule, greaterThan_rule ] });
At the beginning of this book we said that it is important to make our web maps easy to understand for users and as fast as possible. We looked at styles, rules, and filters objects, now we will introduce the strategy class that is responsible for how OpenLayers requests remote data and what it does with the returned features.
We have already used Strategy.Fixed in the previous examples, now we will introduce the Strategy.BBOX and Strategy.Cluster classes:
Strategy.Fixed: As you may remember, this class requests for data once and never again.Strategy.BBOX: This class requests for data within the visible extent of the map. It is usually adopted to retrieve WFS data and it is particularly advantageous when you are working with a lot of feature. Note that it does not take effect if applied to static sources as, for example, GeoJSON local files.Strategy.Cluster: This class is applicable to point features and tells OpenLayers to group them on the basis of their distance in pixels before drawing them. This strategy needs to be combined with other fixed or BBOX strategies that are specifically in charge to retrieve data.Note
Fixed, BBOX, and cluster are part of the available strategy classes. If you want to learn more about strategies and see them in action, visit the OpenLayers official website and explore the examples page available at http://openlayers.org/dev/examples/
In the next example, we will combine the Strategy.BBOX and Strategy.Cluster classes. This is a solution that could actually save you when working with vector layers . It containing tons of point features and maintaining your web map responsive and easy to read. Moreover, this strategy combo can be used to obtain very expressive representations through a simple but powerful feature called attributes replacement. It is achieved by defining a context object inside the OpenLayers.Style object specified for your vector layer.
If you look at the previous example's map, what you see could be a little confusing! There are areas in which points representing earthquakes overlap each other and it is difficult to understand what is happening. Let's clarify things!
Make a copy of
recipe_12.htmland name itrecipe_13.html.Modify your GeoRSS vector layer definition by substituting the fixed strategy with the BBOX one and adding the cluster strategy in the
strategiesarray. The changes are shown in the following code snippet:var earthquakes = new OpenLayers.Layer.Vector("USGS Feed",{ protocol: new OpenLayers.Protocol.HTTP({ url: "http://earthquake.usgs.gov/earthquakes/ feed/atom/2.5/month", format: new OpenLayers.Format.GeoRSS() }), strategies: [ new OpenLayers.Strategy.Fixed(), new OpenLayers.Strategy.Cluster() ] });Try to run
recipe_14.htmlin the browser and note that the map is cleaner. The reason, as you may easily realize, is that point features are no longer represented one by one, but they are aggregated and drawn as clusters:
Now your web map looks clean, but its informative value is very low because it is not possible to understand, at a glance, how many points are included in each cluster. We need to take profit from a style object based on a custom function taken as value of a
contextobject:var earthquakes = new OpenLayers.Layer.Vector("USGS Feed",{ protocol: new OpenLayers.Protocol.HTTP({ url: "http://earthquake.usgs.gov/earthquakes/ feed/atom/2.5/month", format: new OpenLayers.Format.GeoRSS() }), strategies:[ new OpenLayers.Strategy.Fixed(), new OpenLayers.Strategy.Cluster() ], styleMap: new OpenLayers.StyleMap({ 'default': new OpenLayers.Style({ fillColor:'#CC3333', strokeColor:'#FFF', graphicName:'circle', fontColor:'#FFF', fontSize:'10', pointRadius:'${radiusFn}', label:'${labelFn}' },{ context: { radiusFn:function(features){ var fc = features.attributes.count; if (fc == 1){ return 6; } else if ((fc>1)&&(fc<25)){ return 10; } else if ((fc>25)&&(fc<100)){ return 12; } else { return 15; } }, labelFn:function(features){ var fc = features.attributes.count; if (fc > 1){ return fc; } else { return ''; } } } }) }) });Run the example again in your browser and try to navigate and zoom to see how clusters explode and implode depending on the zooming level:

Let's explain what happened:
First of all, we added a
styleMapobject to the vector layer and specified a defaultStyleobject with some attributes. Just to show you an alternative, this time we created the style directly into the vector layer definition (in a different way than what we used for the thematic map's example).Among the
Styleobject's properties, two are valorised by using an attribute replacement function:pointRadius:'${radiusFn}', label:'${labelFn}'The
contextobject, specified as an optional parameter of theStyleobject, hosts theradiusFnandlabelFnfunctions. These functions take the features as arguments and return, respectively, a proper value for the radius and the label properties of each cluster on your web map. In this case, the attribute we consider is the number of points (earthquakes) clustered together.