Book Image

Mastering Symfony

Book Image

Mastering Symfony

Overview of this book

In this book, you will learn some lesser known aspects of development with Symfony, and you will see how to use Symfony as a framework to create reliable and effective applications. You might have developed some impressive PHP libraries in other projects, but what is the point when your library is tied to one particular project? With Symfony, you can turn your code into a service and reuse it in other projects. This book starts with Symfony concepts such as bundles, routing, twig, doctrine, and more, taking you through the request/response life cycle. You will then proceed to set up development, test, and deployment environments in AWS. Then you will create reliable projects using Behat and Mink, and design business logic, cover authentication, and authorization steps in a security checking process. You will be walked through concepts such as DependencyInjection, service containers, and services, and go through steps to create customized commands for Symfony's console. Finally, the book covers performance optimization and the use of Varnish and Memcached in our project, and you are treated with the creation of database agnostic bundles and best practices.
Table of Contents (17 chapters)
Mastering Symfony
Credits
About the Author
About the Reviewers
Index

The dashboard's contents


The dashboard is a critical page. This is where we get an idea about the interaction between projects, members, and tasks in the current workspace. It should carry enough elements to provide a quick report about the activities that are happening in the application and, at the same time, it should be light enough to keep the loading time reasonably short.

For our MVP purposes, I would say that the following items should be enough:

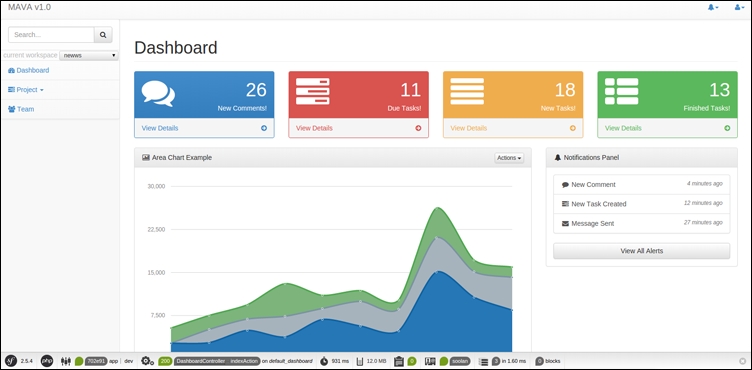
  • A block showing the number of new comments on tasks

  • A block showing the number of due tasks

  • A block showing the number of recently created tasks

  • A block showing the number of completed tasks

  • A notification panel showing the last seven events (notifications)

  • A graph representing the visual progress of the current project

According to these blocks, the finished dashboard page will look like the following image:

Visual blocks that provide statistics about tasks

Looking at the top blocks, three of them are dealing with tasks. What we are going to do is...