
Exploring business drivers and the application
It's always a good idea to have a solid understanding of why an application exists, how it came to be, and what problems or opportunities it looks to solve. This application is a concept application that involves Internet of Things (IoT) devices, distributed event ingestion at scale, and facial recognition features. The primary market for this application is for turnstiles used at mass transit locations:
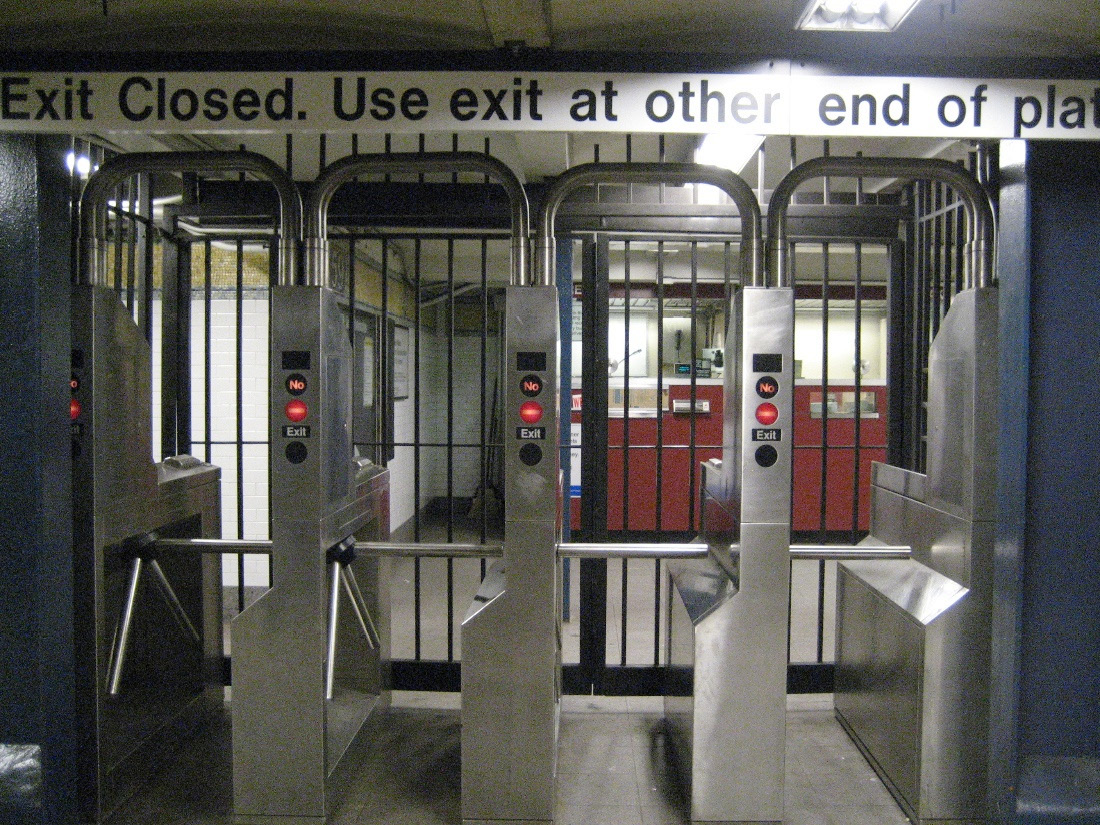
Figure 1.1 – Turnstiles in use at a transit station
In this scenario, the baseline events capture a simple count of customers who pass through the turnstiles at both the entrance and exit points of the mass transit system. Some drivers that contribute to the concept of the application, along with its need, include the following:
- To increase the visibility of equipment health and the need for proactive maintenance
- To allow integration for facial recognition sensors that can scan law enforcement databases for potential fugitives or persons of interest
- To manage costs associated with turnstile equipment, with options for expanding to fare payment interfaces
- To analyze transit usage, turnstile placement, and the need for additional units in high-volume areas
Having the ability to capture foot traffic related to the entrance and exit points of a transit station has several benefits. First, it can be used to understand how busy any one station is. Second, with extended use, the equipment can wear down and eventually break. With a line of sight into how many people are using the equipment, technicians can make educated decisions regarding when units might need to be serviced or ultimately replaced. This could also lead to the deeper monitoring of other components besides the turnstile unit, such as the payment interfaces. Some units might only have a ticket scanner, while others might have a ticket scanner and an electronic payment interface, where contactless payments using mobile devices can be used. The monitoring of normal usage, malfunctions, and scheduling the proactive servicing of those components could also be beneficial.
An additional use case could be that of transit scheduling and vehicle availability. Generally, the number of vehicles (such as trains, trams, buses, and more) any transit authority might have in its fleet is a direct result of them already monitoring customer traffic demands. Using data that has been captured in real time can help accelerate the analysis of needed schedule adjustments, fleet adjustments, or reductions in services for less-traveled stations.
The addition of facial recognition software to the equipment is not a hard requirement but does offer a value-add in the ability to potentially identify criminals at large or suspects who are wanted for questioning. With any artificial intelligence, it is essential to both program and operate with ethics and security in mind. While closed-circuit cameras and more advanced video surveillance equipment can be found in many transit stations, those cameras do not immediately notify anyone if a person has been recognized based on an alert or a bulletin issued by a law enforcement agency. Data collected during facial scans must be treated as personally identifiable information and must be purged if no match has been found.
Unpacking this a bit more, other potential drivers could come into play. For example, examining the business requirements for the application would add clarity. Looking at the domain model and any domain-specific language (DSL) associated with the requirements would help remove any ambiguity around what is meant by a customer, an order, an item, or even a payment method. Let's take a look at the domain model to get a better understanding of the layout of the different services, contexts, and aggregates.
Reviewing the domain model
The application's domain model describes the functional areas (domains) that live within the confines of the application. Each is developed using a ubiquitous language that everyone—from business analysts to senior leadership, to junior developers—can easily understand and relate to. Figure 1.2 represents a simple domain model diagram that aligns to the structure of the application:
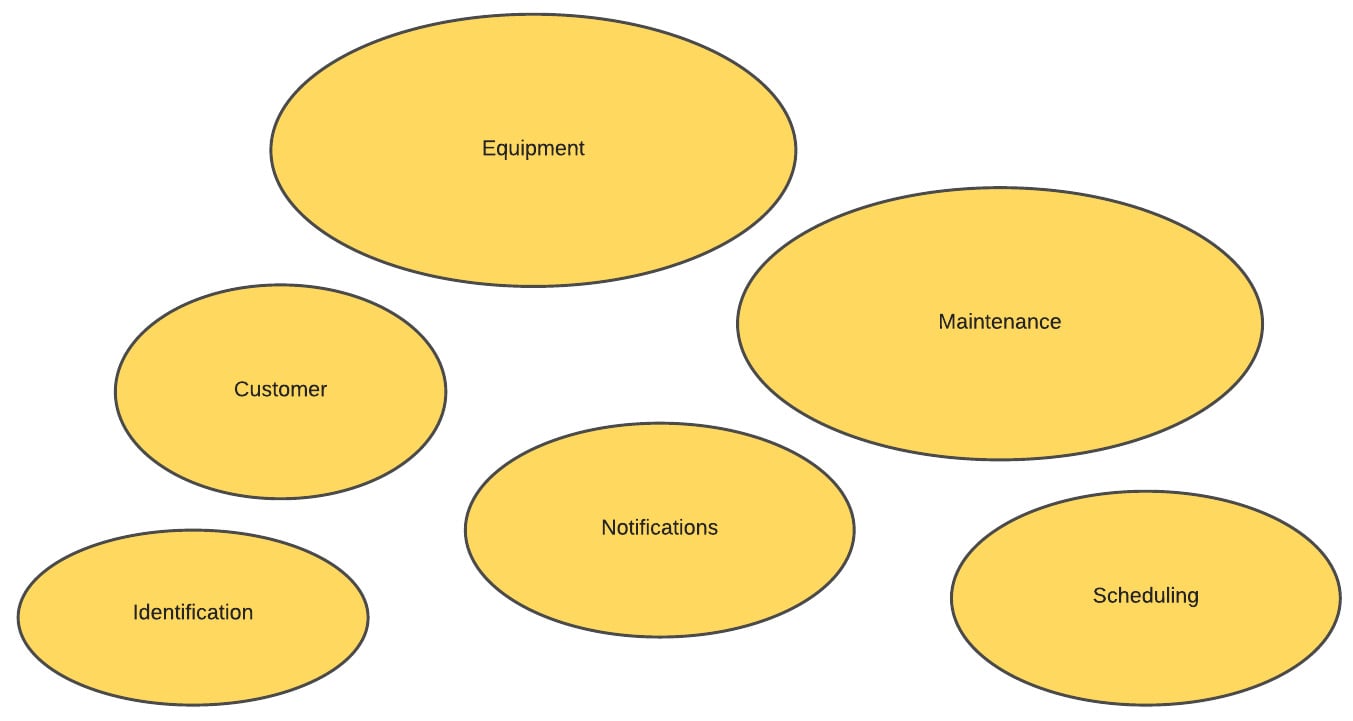
Figure 1.2 – A high-level domain model
The primary domains we will reference for this application are related to the primary pieces of functionality the application looks to offer. The following table offers a description of each domain:
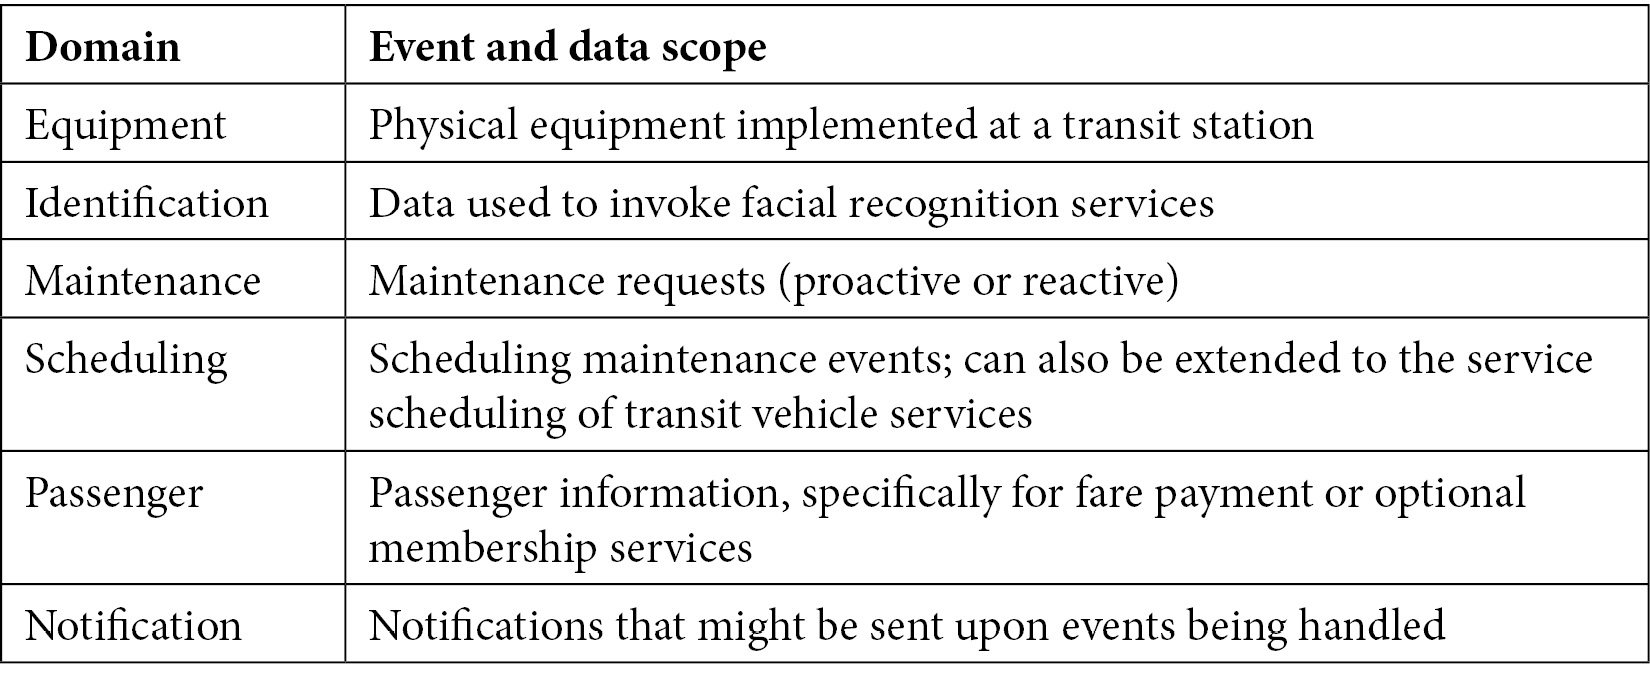
Table 1.1 – Application functions
With these baseline domains defined, some simple rules of engagement can be derived. For example, a passenger could use a piece of equipment to enter a transit station while being run through facial recognition by the Identification domain. Equipment could raise an error noting a malfunction, which could then schedule a maintenance event. Equipment events such as turnstile operations could fire events per turn, allowing the aggregation of passenger throughput per turnstile and per station. These interactions can then be broken into areas of overlapping concern and, ultimately, help derive aggregate roots that are important to the model and the application. They include the following:
- Passenger
- Station
- Turnstile
- Camera
NotificationConfigurationTurnstileMaintenanceScheduleCameraMaintenanceSchedule
Each of the aggregates will contain common properties such as the name and the ID. Some differences between entities and value objects related to the aggregates will be required, as each one will have its own requirements for data, as prescribed by the domain. Figure 1.3 represents a high-level diagram of each aggregate, including properties (the list items), entities (the white rounded rectangles), and value objects (the green rounded rectangles):
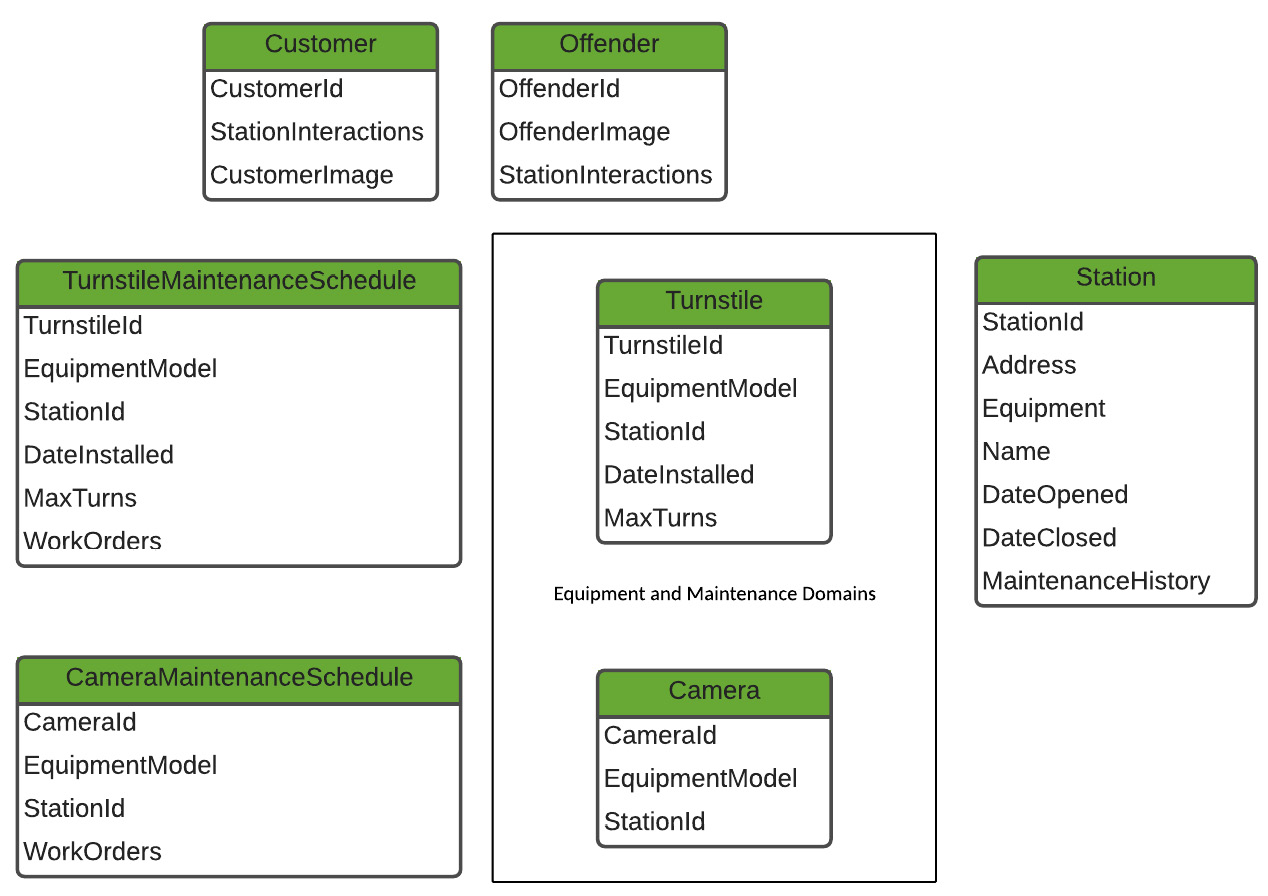
Figure 1.3 – A high-level aggregate view
Chapter 4, Domain Model and Asynchronous Design, dives deeper into the domain model, including a review of events and event handlers and asynchronous design.
With an understanding of the business relevance and the domain model that supports the business case, next, we can go one level deeper and examine some of the architectural structures and paradigms that help to define the event-driven nature of this application.