

Firebug set the standard for good debugging support, and Chrome web development tools are not a port of Firebug to Chrome, but are for Chrome what Firebug is for Firebox. Both are powerful; for CSS work, sometimes there may be things visible in Firebug that do not show up in Chrome.
Firebug's console displays the output of console.log(), and it also displays requests (GET, POST, and the like), which you can drill down and see their contents.
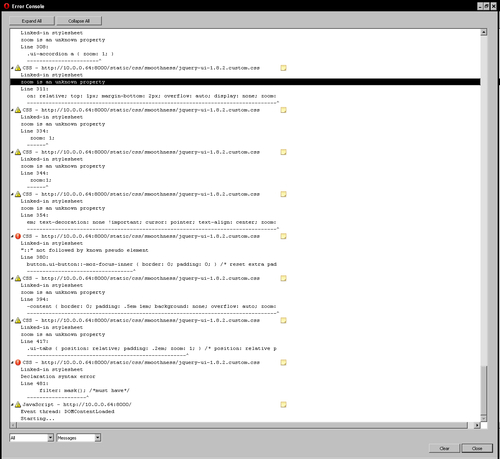
One helpful thing when something isn't working is to look at what the server is returning in response to requests. The basic question is whether the server is sending good data that the client is not handling properly, or whether the server is sending bad data: in terms of scientific debugging, this is a way to narrow down where the bug is hiding.
The console, with the output of console.log() statements, looks like this:
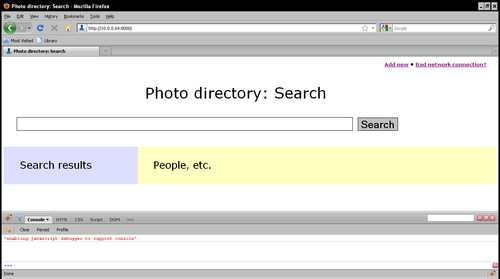
It is accessed by installing Firebug from http://getfirebug.com/ and then clicking the bug icon at the bottom-right of your window:
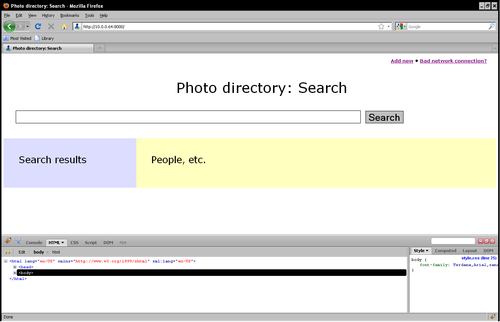
Google Chrome has developer tools under its View menu, and lets you see the JavaScript console:
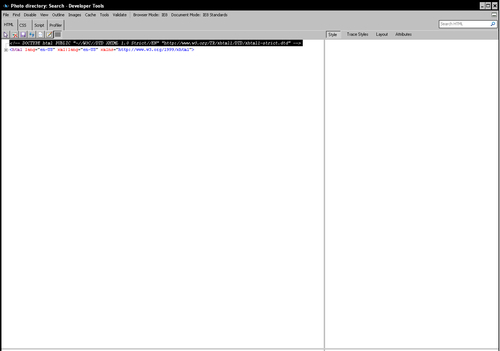
Internet Explorer has developer tools available as shown in the following:
And in Opera, we have the following:
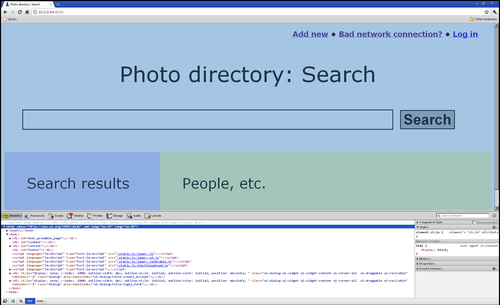
Chrome has the following tabs/buttons:
Resources, which is a dashboard for seeing what the delays were in a page being rendered.
Scripts, which provides debugger services in the tradition of GDB for debugging JavaScript, including setting breakpoints, seeing the values of variables, and so on.
Timelines, which can be used to track resource usage for optimization. The bottom-left hand of the screen has record/stop and clear buttons:

Profiles, which allows CPU and memory usage profiling.
Storage, which looks at cookies, sessions, HTML5 databases, and other local storage.
Audits, which are meant to support third-party plugins to audit pretty much anything: mobile readiness, network optimization, and so on.
Console, which provides a command-line console that includes but goes beyond Firebug's command line.
What you can see, in terms of the DOM, JavaScript, CSS, and so on, you can modify to allow surgical experiments rather than reloading a page and doing multiple things to keep track of state. In keeping with "Where there is output, let there be input," clicking, double-clicking, or right-clicking on the live DOM model, JavaScript code, properties in CSS as well as the DOM or JavaScript, and the like, can be used to modify existing values.
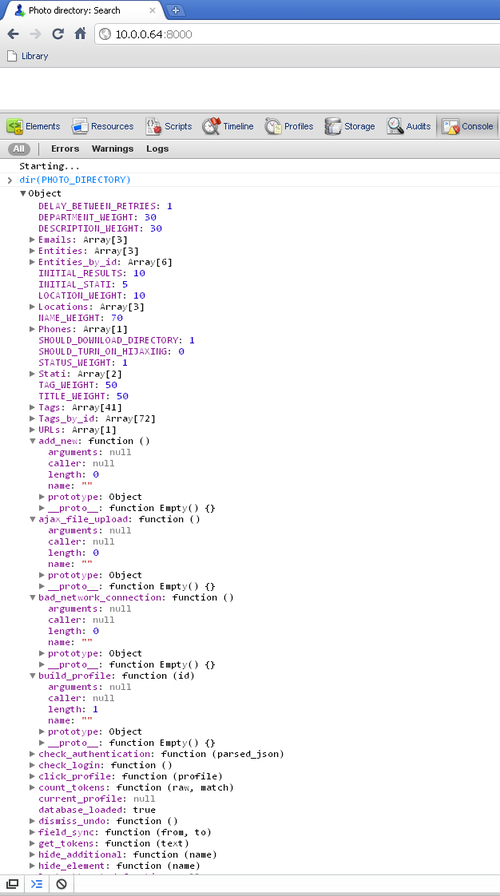
Firebug got the game going and showed what it was to utilize a JavaScript debugger correctly. Internet Explorer has something vaguely in the same vein, but perhaps not a full-blooded replacement. Google in making Chrome tried to see how far they could push the envelope; as already mentioned, the developer tools are for Chrome what Firebug is for Firebox, but they are not a Firebug port. They are extremely deep and worth a book in their own right; Google's resources on the web can be found at http://www.chromium.org/devtools, with an in-depth video at http://tinyurl.com/GoogleChromeDevToolsInDepth, to which we refer the reader for further study. A dir(), for example, of our PHOTO_DIRECTORY namespace yields both a broad overview and deep possibilities for drilling down:
Let's stop a minute and pause for a moment of, "That's funny…"
We are not now actively trying to solve a bug, but we may have stumbled on something odd: this screenshot shows three Entities and six Entities_by_id. Our off-the-cuff expectation may be that that the two counts should be the same. Even though we aren't actively trying to track down a bug, nor address symptoms, this may be the root cause of a bug.
Before we drill down it would help to think. There are at least two obvious expectations, one or both of which may be wrong. It could be that Entities_by_id are getting things twice; we observe that six Entities_by_id is exactly a multiple of three Entities. Or it could just be a few more. If there are Entities that have been deleted, it could be that Entities_by_id reflects deleted entries and Entities does not. With that in mind, let's drill down and see what we see, how well the system treats our hypotheses:
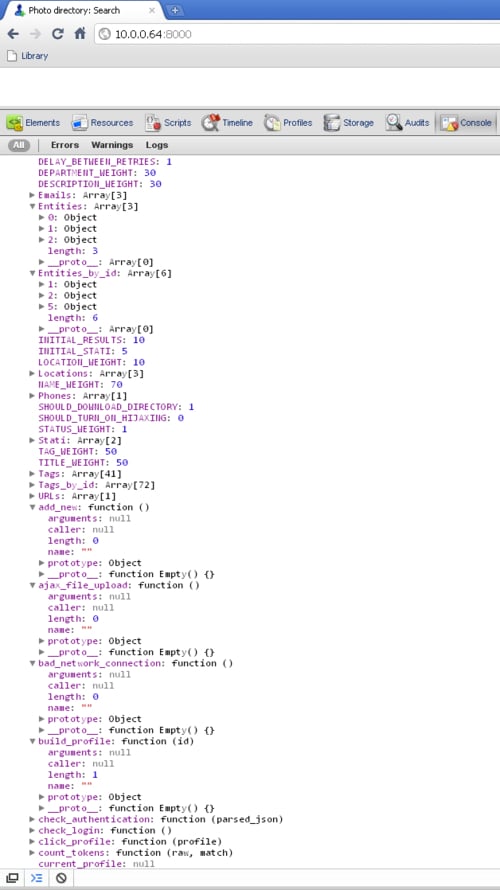
This suggests another explanation, that despite Chrome leading us to believe we have a six-element array, we might have an array of length 6 from JavaScript's perspective, but the keys used to populate it max out at five. It has exactly three physical entries, just like the other. Let's go over to the Scripts page and select the :8000/ entry (the one for JavaScript on the page, although we can see other source files too). That reads as follows:
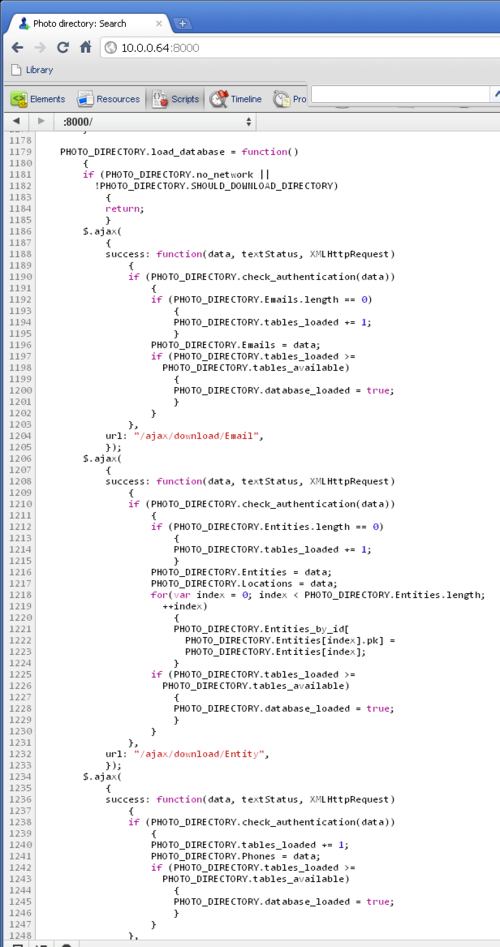
load_database() loads into Entities_by_id exactly what the name would suggest: it is being used as a hash with what turn out to be primary keys assigned by Django, and this installation has some entries that are deleted, leaving holes. It so happens that, for our implementation, the JavaScript interpreter treats this as a (slightly) sparse integer array.
This particular bug hunt was a lottery ticket that, like most lottery tickets, didn't pan out. However, it is an example of how to debug live, and live debugging isn't just when you use the tool optimally and pin down an annoying bug with seven symptoms. That may be the kind of story we prefer to tell our fellow programmers, but it isn't the only story in a debugging phase of programming. It is a live example of the exploratory process that sometimes finds the bugs being traced, sometimes stumbles on unrelated bugs, and sometimes doesn't turn up anything interesting. (Or it may turn up something else interesting, like a juicy hook for an improved feature offering.)
The point of debugging remains scientific debugging, even with tools at our fingertips that will do all this and more.