

In this section, we will use D3 and Backbone to create a single page application to display a time series of stock prices. The user will be able to select different stocks and a period of time in order to get a detail view. The page will have several components:
Context chart: This chart will display the complete series of prices that are available for the stock. It will have a brush component that selects a time interval.
Detail chart: This will be a bigger area chart that will show you the stock prices for the time interval selected in the context chart.
Control view: This view will show you a control that selects the stock.
We will display the control and title view on top of the page, a big area with the detail view, and a context area chart at the bottom of the page.
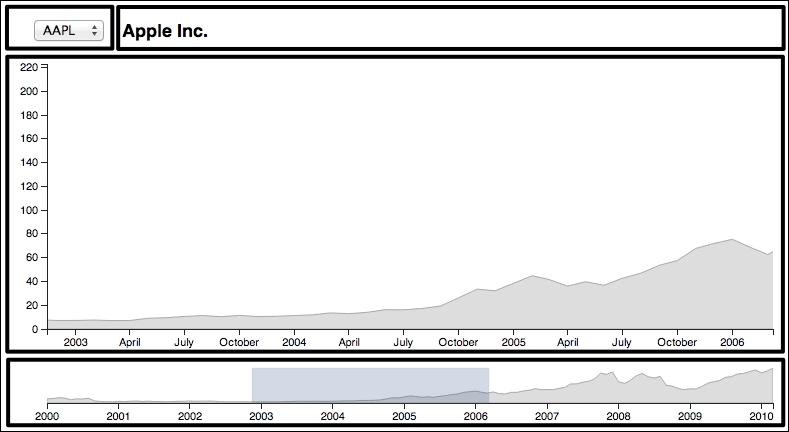
A diagram of the application components
As you can see, there are several components that should be in sync. If we change the stock, the...