

Handwritten digits can be recognized with k-nearest neighbor algorithm.
Each handwritten digit is written on a 28*28 matrix. So there are 28*28 -> 784 pixels and each of these are represented as a single column of the dataset. Thus, the dataset has 785 columns. The first column is the label/digit and the remaining 784 values are the pixel values.
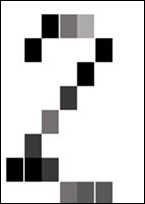
Following is a small example. Let's say, if we're to imagine this example as an 8 by 8 matrix, we would have something like the following figure for the digit 2:
A matrix can be represented as a 2-D array where each pixel is represented by each cell. However, any 2-D array can be visually unwrapped to be a 1-D array where the length of the array is the product of the length and the breadth of the array. For example, for the 8 by 8 matrix, the size of the single dimensional array will be 64. Now if we store several images and their 2D matrix representations, we will have something as shown in the following spreadsheet:
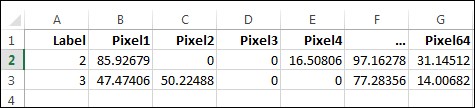
The header Label denotes the number and the remaining values are the pixel values. Lesser the pixel values, the darker the cell is in the pictorial representation of the number 2, as shown previously.
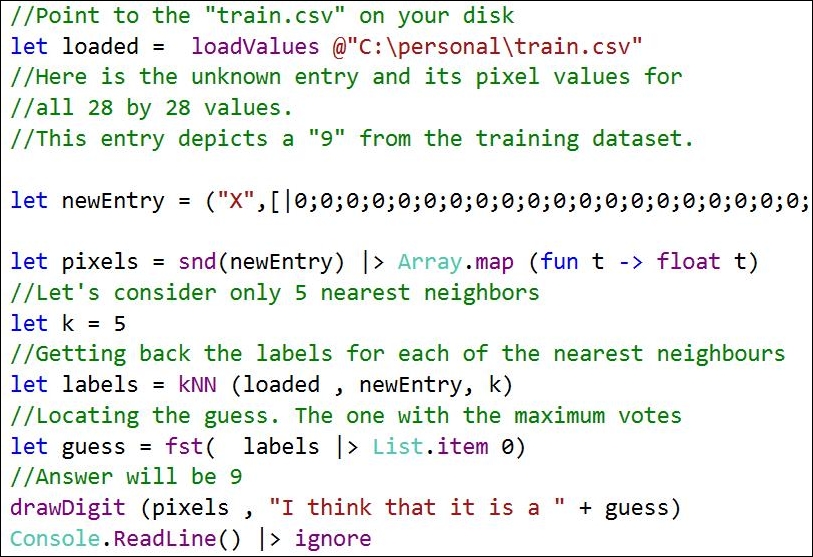
In this program, you will write code to solve the digit recognizer challenge from Kaggle, available at:
https://www.kaggle.com/c/digit-recognizer.
Once you get there, download the data and save it in some folder. We will be using the train.csv file (You can get the file from www.kaggle.com/c/digit-recognizer/data) for training our classifier. In this example, you will implement the k nearest neighbor algorithm from scratch, and then deploy this algorithm to recognize the digit.
For your convenience, I have pasted the code at https://gist.github.com/sudipto80/72e6e56d07110baf4d4d.
Following are the steps to create the classifier:
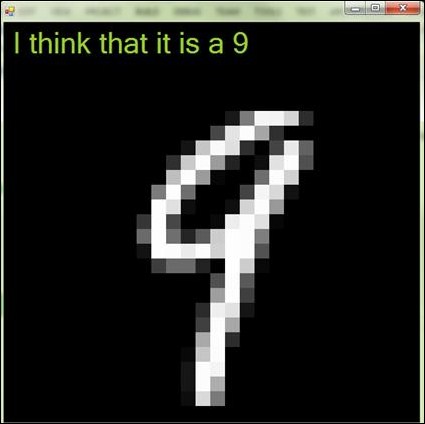
When this program runs, it will produce the following output:
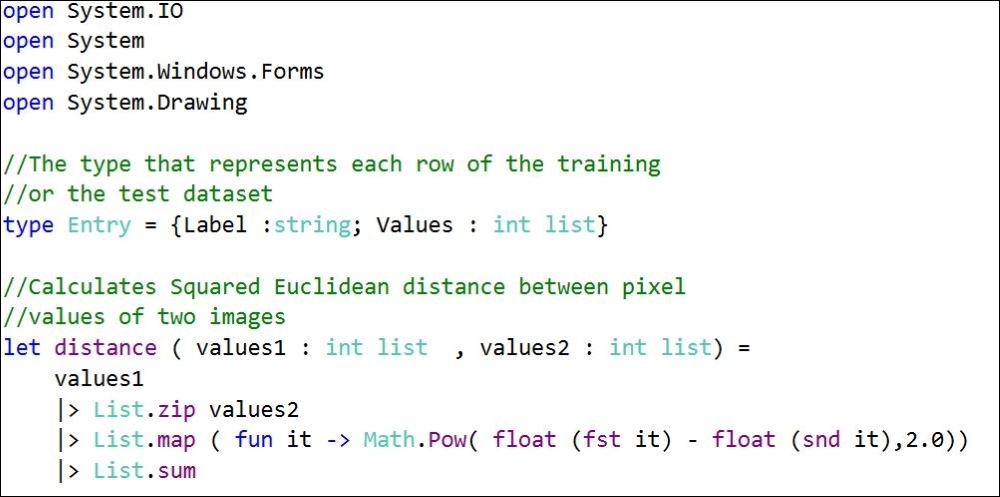
The distance function is based on the Euclidean distance function, as mentioned earlier in the chapter. Now you see that a general purpose Euclidean distance function is coded in the distance function. You might have noticed that there is a small difference between the formula and the implementation. The implementation finds the squared Euclidean distance given by the following formula:

Here  and
and  denote the two vectors. In this case,
  might denote one example from the training set and
  might denote the test example or the new uncategorized data that we have depicted by
 newEntry in the preceding code.
The loadValues function loads the pixel values and the category for each training/test data, and creates a list of Entry types from the CSV file.
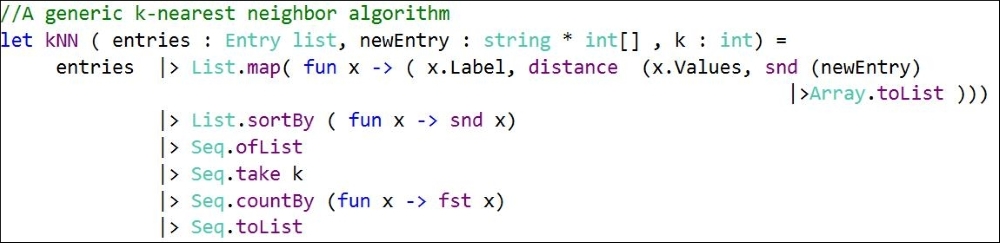
The k-NN algorithm is implemented in the kNN function. Refer to the following line of code:
|> List.map( fun x -> ( x.Label, distance (x.Values, snd (newEntry) |>Array.toList )))
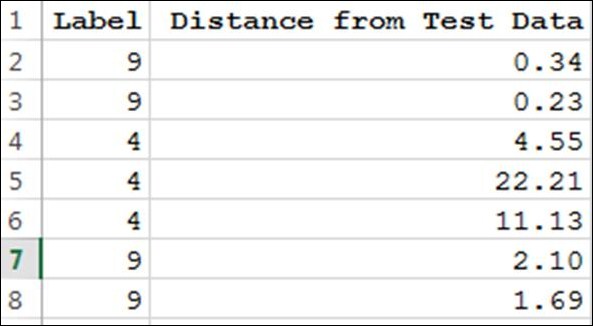
This preceding code creates a list of tuples where the first element is the category of the entry and the second is the distance square value for the test data from each of the training entry. So it might look as follows:
Now consider the following line:
|> List.sortBy ( fun x -> snd x)
It sorts this list of tuples based on the increasing distance from the test data. Thus, the preceding list will become as shown in the following image:
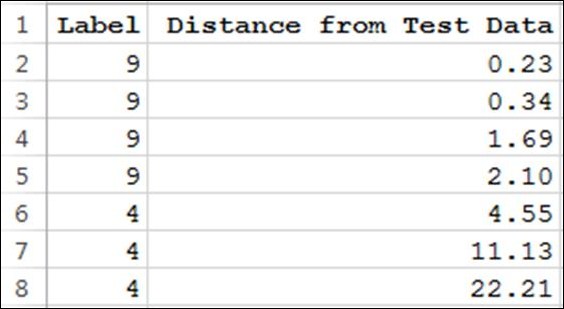
If you see, there are four 9s and three 4s in this list. The following line transforms this list into a histogram:
|> Seq.countBy (fun x -> fst x)
So if k is chosen to be 5, then we will have four 9s and one 4. Thus, k nearest neighbor will conclude that the digit is probably a "9" since most of the nearest neighbors are "9".
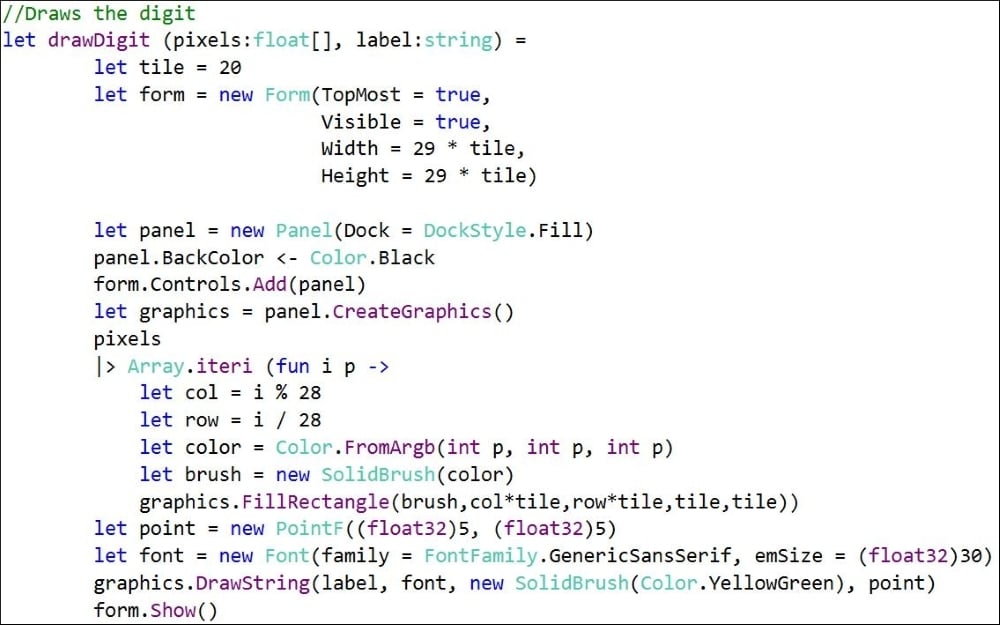
The drawDigit function draws the digit pixel by pixel and writes out the guessed label for the digit. It does so by drawing each pixel on a tile size of 20.