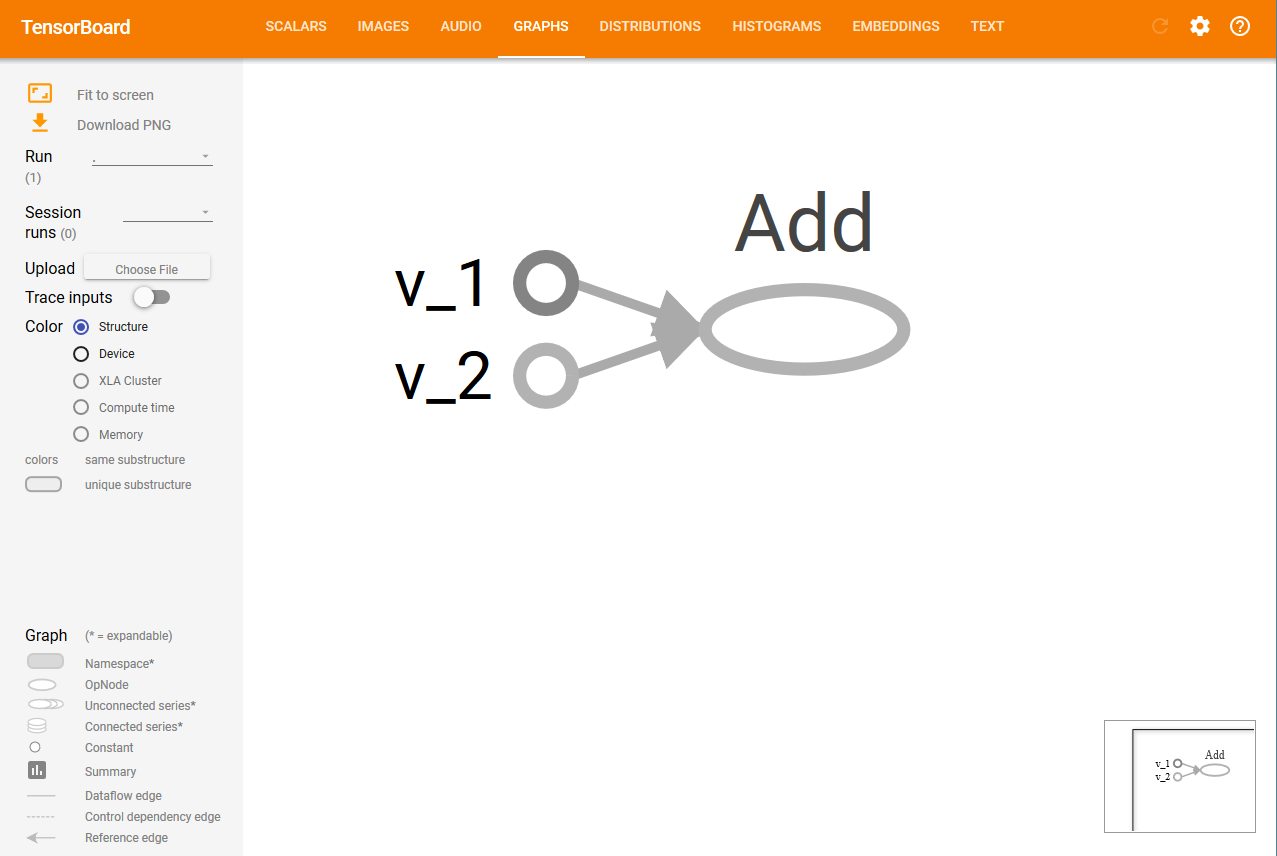

TensorFlow has TensorBoard to provide a graphical image of the computation graph. This makes it convenient to understand, debug, and optimize complex neural network programs. TensorBoard can also provide quantitative metrics about the execution of the network. It reads TensorFlow event files, which contain the summary data that you generate while running the TensorFlow Session.
Using a data flow graph
How to do it...
- The first step in using TensorBoard is to identify which OPs summaries you would like to have. In the case of DNNs, it is customary to know how the loss term (objective function) varies with time. In the case of Adaptive learning rate, the learning rate itself varies with time. We can get the summary of the term we require with the help of tf.summary.scalar OPs. Suppose, the variable loss defines the error term and we want to know how it varies with time, then we can do this as follows:
loss = tf...
tf.summary.scalar('loss', loss)
- You can also visualize the distribution of gradients, weights, or even output of a particular layer using tf.summary.histogram:
output_tensor  = tf.matmul(input_tensor, weights) + biases
tf.summary.histogram('output', output_tensor)
- The summaries will be generated during the session. Instead of executing every summary operation individually, you can define tf.merge_all_summaries OPs in the computation graph to get all summaries in a single run.
- The generated summary then needs to be written in an event file using tf.summary.Filewriter:
writer = tf.summary.Filewriter('summary_dir', sess.graph)
- This writes all the summaries and the graph in the 'summary_dir' directory.
- Now, to visualize the summaries, you need to invoke TensorBoard from the command line:
tensorboard --logdir=summary_dir
- Next, open your browser and type the address http://localhost:6006/ (or the link you received after running the TensorBoard command).
-
You will see something like the following, with many tabs on the top. The Graphs tab will display the graph: