Book Image

Hands-On Machine Learning with Azure

By : Thomas K Abraham, Parashar Shah, Jen Stirrup, Lauri Lehman, Anindita Basak
Book Image

Hands-On Machine Learning with Azure

By: Thomas K Abraham, Parashar Shah, Jen Stirrup, Lauri Lehman, Anindita Basak

Overview of this book

Implementing Machine learning (ML) and Artificial Intelligence (AI) in the cloud had not been possible earlier due to the lack of processing power and storage. However, Azure has created ML and AI services that are easy to implement in the cloud. Hands-On Machine Learning with Azure teaches you how to perform advanced ML projects in the cloud in a cost-effective way. The book begins by covering the benefits of ML and AI in the cloud. You will then explore Microsoft’s Team Data Science Process to establish a repeatable process for successful AI development and implementation. You will also gain an understanding of AI technologies available in Azure and the Cognitive Services APIs to integrate them into bot applications. This book lets you explore prebuilt templates with Azure Machine Learning Studio and build a model using canned algorithms that can be deployed as web services. The book then takes you through a preconfigured series of virtual machines in Azure targeted at AI development scenarios. You will get to grips with the ML Server and its capabilities in SQL and HDInsight. In the concluding chapters, you’ll integrate patterns with other non-AI services in Azure. By the end of this book, you will be fully equipped to implement smart cognitive actions in your models.
Table of Contents (14 chapters)

Using SQL in Azure Databricks

In this section, you can run a SQL statement to create a table and work with data using SQL Statements:

  1. Copy and paste this code snippet into the notebook cell to see a list of the Azure Databricks datasets:
display(dbutils.fs.ls("/databricks-datasets"))
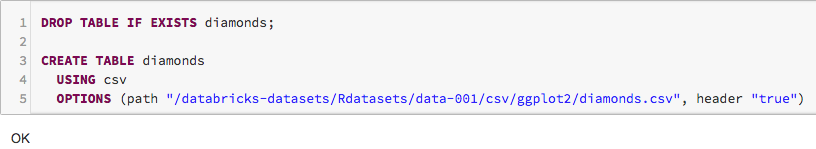
  1. The code appears as follows:
DROPTABLEIFEXISTS diamonds;
CREATETABLE diamonds
USING csv
OPTIONS (path "/databricks-datasets/Rdatasets/data-001/csv/ggplot2/diamonds.csv", header "true")

  1. Press Shift + Enter. The notebook automatically attaches to the cluster you created in Step 2, creates the table, loads the data, and returns OK:
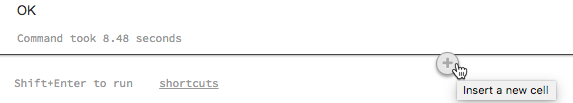
  1. Next, you can run a SQL statement to query the table for the average diamond price by color.
  2. To add a cell to the Notebook, hover over the cell bottom and click the icon:
  1. Copy this snippet and paste it into the cell:
SELECT color, avg...