

Now that we know the prerequisites, let's quickly check the language dependencies:
We can check the Java version using the following code:
$ java –version
java version "1.7.0_45"
The Python version can be checked using this command:
$ python –version
Python 2.6.6
Since we're running only single node, we can skip configurations and directly start our node. Run the Cassandra node using the command for tarball installation:
$ bin/Cassandra
We can stop the server by using the following command:
$ pgrep -u `whoami` -f cassandra | xargs kill -9
Sometimes, we might want to run a Cassandra node in the foreground for debugging purposes, then we'll run it with –f flag:
$ bin/cassandra –f
To stop, press Ctrl + C.
For package-based installations, use the following commands to start and stop, respectively:
$ sudo service Cassandra start
$ sudo service Cassandra stop
Wohooo!! Our node is running, let's check our Cassandra server version:
$nodetool version
ReleaseVersion: 2.1.2
Let's set up a three-node cluster with the IPs 127.0.0.1, 127.0.0.2 and 127.0.0.3. So, our Cassandra.yaml for each node will look like this:
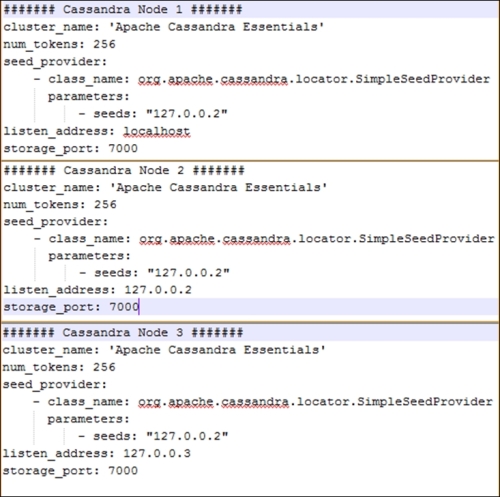
Since all our nodes are the same from a hardware configuration perspective, we used num_tokens: 256 for all of them. The second node with an IP address of 127.0.0.2 acts as a seed node.
Additionally, we can set rpc_address and native_transport_ports for each node so that our Java client can connect to our nodes.
Now, we'll run the Cassandra server on each node using as discussed in the previous section, and our cluster with three nodes is ready.
Now that our cluster is up and running, let's check its status. We can use the Cassandra tool called nodetool to check the status:
$ nodetool status
Datacenter: datacenter1
=======================
Status=Up/Down
|/ State=Normal/Leaving/Joining/Moving
--  Address        Load       Tokens  Owns    Host ID
Rack
UN  127.0.0.1   171.88 MB     256     ?       940ba0cf-b75a-448c-a15e-40e05efbeb34  rack1
UN  127.0.0.2   141.12 MB     256     ?       4b728c3c-c545-4e4d-b1aa-2f66ef6bdce  rack1
UN  127.0.0.3   174.71 MB     256     ?       d63a18c4-0d2c-4574-8f66-c4eb1e5ca5a8  rack1
Note: Non-system keyspaces don't have the same replication settings, effective ownership information is meaningless
The first character in the status, which is U in our example, denotes the node's status whether it is Up (U) or Down (D). The second character tells us about the state of the joining cluster; it can be Normal (N), Leaving (L), Joining (J), or Moving (M). In our example, every node in the cluster is Up (U) and in the Normal (N) state. So, the first column is UN for each node. It also tells us about the data center in which our node lies. In our example, all the nodes lie in 'DataCenter 1' and rack 'rack1'.
Now, let's use the nodetool info command to check the individual node statistics such as its uptime, caching details, load details, and so on. We'll discuss Cassandra caching in detail in Chapter 4, Read and Write – Behind the Scenes:
$ nodetool info
ID               : 2f9bb0a9-db48-4146-83c6-4ce06bd22259
Gossip active    : true
Thrift active    : true
Native Transport active: true
Load             : 179.4 MB
Generation No    : 1422937400
Uptime (seconds) : 593431
Heap Memory (MB) : 474.63 / 920.00
Data Center      : datacenter1
Rack             : rack1
Exceptions       : 0
Key Cache        : entries 226, size 23.07 KB, capacity 45 MB, 4714 hits, 5006 requests, 0.942 recent hit rate, 14400 save period in seconds
Row Cache        : entries 0, size 0 bytes, capacity 600 MB, 0 hits, 0 requests, NaN recent hit rate, 3000 save period in seconds
Counter Cache    : entries 0, size 0 bytes, capacity 22 MB, 0 hits, 0 requests, NaN recent hit rate, 7200 save period in seconds
Token            : (invoke with -T/--tokens to see all 256 tokens)