

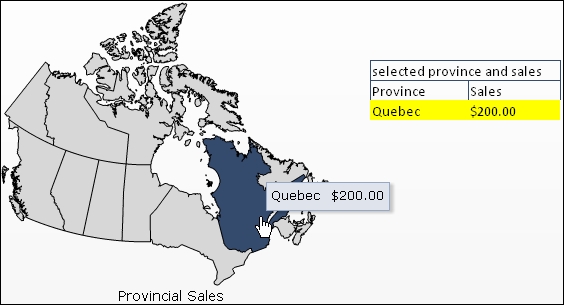
Using maps on a dashboard allows us to visually identify data using a picture instead of a table/chart, for example to analyze which regions of an area are doing poorly versus which regions are doing well. As you can see by looking at the following map of Canada, users are able to visually distinguish between each province:
Select a map component from the Maps section. In our example, we will use Canada.

In the map's properties, bind the region keys as shown in the following screenshot.
Tip
Tip to find map regions:
A full list of the region keys for each map included in SAP BusinessObjects Dashboards can be found in the
MapRegions.xlsspreadsheet in the<install path>\Xcelsius 4.0\assets\samples\User Guide Samples\directory.
Next, bind the Display Data, which will be the key/value pair. The key comes from the key that you used in step 2 and the value can be any value associated with that key.
