

Using the Trend Analyzer component, you can calculate trends in a series of data. You can then display these trends in a chart so that you can view them next to the actual data and make your analysis. This component can also forecast future trends based on actual data.
For this recipe, we need some data, so open a new SAP BusinessObjects Dashboards file and enter the values in the spreadsheet as shown in the following screenshot:
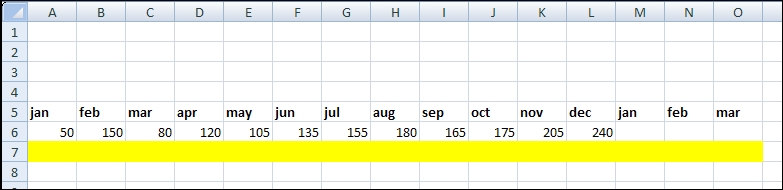
Drag a Combination Chart component into the canvas.
Bind the data By Range to the spreadsheet cells A5:O7.
Drag a Trend Analyzer component from the Other category into the canvas.
Bind the Data field to cells A6:L6.
Set Trend/Regression Type as Linear.
Bind the Analyzed Data Destination field to cells A7:O7.
Set Number of Forecast Periods to
3:
