Book Image

Mastering QGIS - Second Edition

By : Kurt Menke, GISP, Paolo Corti, Richard Smith Jr., GISP, Luigi Pirelli, John Van Hoesen, GISP
Book Image

Mastering QGIS - Second Edition

By: Kurt Menke, GISP, Paolo Corti, Richard Smith Jr., GISP, Luigi Pirelli, John Van Hoesen, GISP

Overview of this book

QGIS is an open source solution to GIS. It is widely used by GIS professionals all over the world. It is the leading alternative to the proprietary GIS software. Although QGIS is described as intuitive, it is also by default complex. Knowing which tools to use and how to apply them is essential to producing valuable deliverables on time. Starting with a refresher on the QGIS basics, this book will take you all the way through to creating your first custom QGIS plugin. From the refresher, we will recap how to create, populate, and manage a spatial database. You’ll also walk through styling GIS data, from creating custom symbols and color ramps to using blending modes. In the next section, you will discover how to prepare vector, heat maps, and create live layer effects, labeling, and raster data for processing. You’ll also discover advanced data creation and editing techniques. The last third of the book covers the more technical aspects of QGIS such as using LAStools and GRASS GIS’s integration with the Processing Toolbox, how to automate workflows with batch processing, and how to create graphical models. Finally, you will see how to create and run Python data processing scripts and write your own QGIS plugin with pyqgis. By the end of the book, you will understand how to work with all the aspects of QGIS, and will be ready to use it for any type of GIS work.
Table of Contents (19 chapters)
Mastering QGIS - Second Edition
Credits
Foreword
About the Authors
About the Reviewer
www.PacktPub.com
Preface
Index

Creating beautiful effects with inverted polygon shapeburst fills


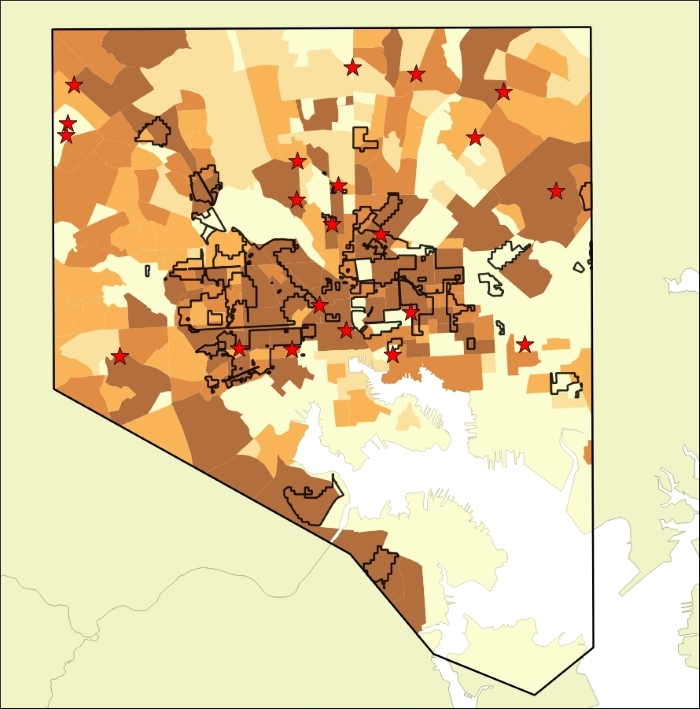
The inverted polygon renderer can be used in combination with a shapeburst fill to create some beautiful effects. Next, you will see two examples of this in a single map covering Baltimore City, Maryland. You will begin by opening the Baltimore.qgs project. The data focuses on diabetes in Baltimore City neighborhoods:

Creating coastal vignettes

It's already a fairly nice map, but there is no data representing the harbor and Chesapeake Bay. It is simply a white hole in the data layers. To make it blue, you could click on Project | Project Properties and change the background color of the map to blue. However, you will now learn a more powerful way to represent this feature:

  1. Right-click on the MD_County_boundaries layer and choose Duplicate. A second copy of the layer will appear in the Layers Panel.

  2. Drag the new copy so that it is between the Neighborhood_diabetes and Baltimore City Boundary layers in the Layers Panel, and turn...