Book Image

Python Data Analysis - Second Edition

By : Ivan Idris
Book Image

Python Data Analysis - Second Edition

By: Ivan Idris

Overview of this book

Data analysis techniques generate useful insights from small and large volumes of data. Python, with its strong set of libraries, has become a popular platform to conduct various data analysis and predictive modeling tasks. With this book, you will learn how to process and manipulate data with Python for complex analysis and modeling. We learn data manipulations such as aggregating, concatenating, appending, cleaning, and handling missing values, with NumPy and Pandas. The book covers how to store and retrieve data from various data sources such as SQL and NoSQL, CSV fies, and HDF5. We learn how to visualize data using visualization libraries, along with advanced topics such as signal processing, time series, textual data analysis, machine learning, and social media analysis. The book covers a plethora of Python modules, such as matplotlib, statsmodels, scikit-learn, and NLTK. It also covers using Python with external environments such as R, Fortran, C/C++, and Boost libraries.
Table of Contents (22 chapters)
Python Data Analysis - Second Edition
Credits
About the Author
About the Reviewers
www.PacktPub.com
Customer Feedback
Preface
Key Concepts
Online Resources

Visualizing data using Matplotlib


We shall learn about visualizing the data in a later chapter. For now, let's try loading two sample datasets and building a basic plot. First, install the sklearn library from which we shall load the data using the following command:

$ pip3 install scikit-learn 

Import the datasets using the following command:

from sklearn.datasets import load_iris 
from sklearn.datasets import load_boston 

Import the Matplotlib plotting module:

from matplotlib import pyplot as plt 
%matplotlib inline 

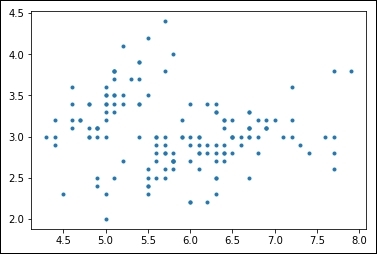
Load the iris dataset, print the description of the dataset, and plot column 1 (sepal length) as x and column 2 (sepal width) as y:

iris = load_iris() 
print(iris.DESCR) 
data=iris.data 
plt.plot(data[:,0],data[:,1],".") 

The resulting plot will look like the following image:

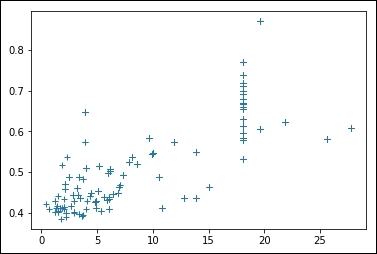
Load the boston dataset, print the description of the dataset and plot column 3 (proportion of non-retail business) as x and column 5 (nitric oxide concentration) as y, each point on the plot marked with a + sign:

boston = load_boston()
print(boston.DESCR)
data=boston.data
plt.plot(data[:,2],data[:,4],"+")

The resulting plot will look like the following image: