Book Image

VMware vRealize Operations Essentials

By : Matthew Steiner
Book Image

VMware vRealize Operations Essentials

By: Matthew Steiner

Overview of this book

This book will enable you to deliver on the operational disciplines of Performance, Health, Capacity, Configuration, and Compliance by making the best use of solutions provided by vRealize Operations. Starting with architecture, design, and sizing, we will ensure your implementation of vRealize Operations is a success. We will dive into the utilization of a solution to manage your vSphere infrastructure. Then, we will employ out-of-the-box Dashboards and the very powerful Views and Reporting functionality of vRealize Operations to create your custom dashboards and address your reporting requirements. Next, we go through the Alerting framework and how Symptoms, Recommendations, and Actions are used to achieve efficient operations. Later you will master the topic of Capacity Planning, where we look at how important it is to craft appropriate policies to match your requirements, and we’ll consider attitude toward capacity risk, which will aid you to build future project requirements into your capacity plans. Finally, we will look at extending the solution to manage Storage, Applications, and other IT infrastructures using Management Packs from Solution Exchange, as well as how the solution can be enhanced with the integration of Log Insight.
Table of Contents (18 chapters)
VMware vRealize Operations Essentials
Credits
Foreword
About the Author
About the Reviewers
www.PacktPub.com
Preface
Index

vRealize Infrastructure Navigator dashboards


The final integration point with vRealize Operations are the two dashboards that are created during the installation of the Management Pack.

The VIN Application Topology dashboard

This is reached by navigating to Home | Dashboard List | VIN | VIN Application Topology. The focus of the dashboard is your list of applications, and it has the following features:

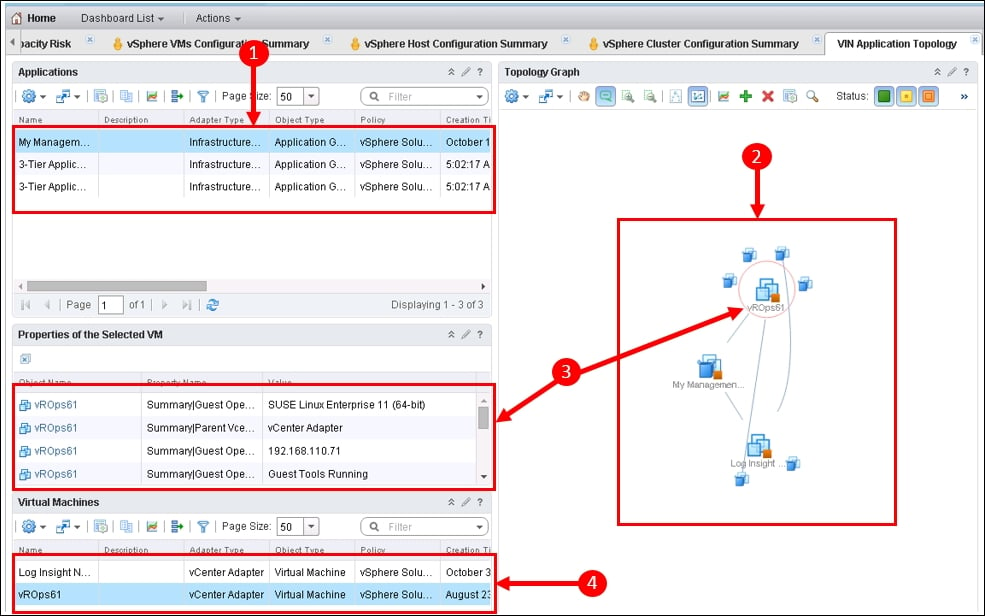
  1. The dashboard context is created by selecting one of your applications in the Applications panel.

  2. A visualization of the Topology of the selected application is shown in the right hand panel.

    Each Virtual Machine in this panel is surrounded by installed, and discovered, applications/services. Connected applications are visualized with connectors.

  3. Selecting a Virtual Machine in the Topology panel populates the panel on the left with the list of discovered applications on that Virtual Machine.

  4. The Virtual Machines panel, at the bottom of the dashboard, is populated with the Virtual Machines defined...