

Setting up Zabbix agent 2 monitoring
With the release of Zabbix 5, Zabbix also officially started support for the new Zabbix agent 2. Zabbix agent 2 brings some major improvements and is even written in another coding language, which is Golang instead of C. In this recipe, we will be exploring how to work with Zabbix agent 2 and explore some of the new features introduced by it.
You'll also need a Linux distribution of your choice running Zabbix agent 2.
Getting ready
To get started with Zabbix agent 2, all we need to do is install it to a (Linux) host that we want to monitor. Make sure you have an empty Linux (CentOS 8) host ready to monitor.
How to do it
Let's see how to install Zabbix agent 2 and then move on to actually working with it.
Installing Zabbix agent 2
Let's start by installing Zabbix agent 2 on the Linux host we want to monitor. I'll be using a CentOS 8 machine:
- Issue the following command to add the repository:
For RHEL-based systems:
rpm -Uvh https://repo.zabbix.com/zabbix/5.0/rhel/8/x86_64/zabbix-release-5.0-1.el8.noarch.rpm
For Debian-based systems:
wget https://repo.zabbix.com/zabbix/5.0/debian/pool/main/z/zabbix-release/zabbix-release_5.0-1+buster_all.deb
dpkg -i zabbix-release_5.0-1+buster_all.deb
- Then issue the following command to install Zabbix Agent 2:
For RHEL-based systems:
dnf install zabbix-agent2
For Debian-based systems:
apt install zabbix-agent2
Congratulations, Zabbix agent 2 is now installed and ready to use.
Using a Zabbix agent in Passive mode
Let's start by building a Zabbix agent with passive checks:
- After installing Zabbix agent 2, let's open the Zabbix agent configuration file for editing:
vim /etc/zabbix/zabbix_agent2.conf
In this file, we edit all the Zabbix agent configuration values we could need from the server side.
- Let's start by editing the following values:
Server=127.0.0.1
Hostname=Zabbix server
- Change
Serverto the IP of the Zabbix server that will monitor this passive agent. ChangeHostnameto the hostname of the monitored server. - Now restart the Zabbix agent 2 process:
systemctl restart zabbix-agent2.service
- Now move to the frontend of your Zabbix server and add this host for monitoring.
- Go to Configuration | Hosts in your Zabbix frontend and click Create host in the top-right corner.
- To create this host in our Zabbix server, we need to fill in the values seen in the following screenshot:

Figure 2.1 – The Zabbix host creation page for host lar-book-agent
It's important to add the following:
- Host name: To identify this host.
- Groups: To logically group hosts.
- Interfaces: To monitor this host on a specific interface. No interface means no communication.
- It is also important to add a template to this host. As this is a Linux server monitored by a Zabbix agent, let's add the correct out-of-the-box template as shown in the following screenshot:

Figure 2.2 – The Zabbix host template page for host lar-book-agent
- Click the Add button and you're done creating this agent host. Now that you've got this host, make sure the ZBX icon turns green, indicating that this host is up and being monitored with the passive Zabbix agent:

Figure 2.3 – The Zabbix configuration hosts page, host lar-book-agent
- You can now see the values received on this host by going to Monitoring | Hosts and checking the Latest data button. Please note that the values could take a while to show up:
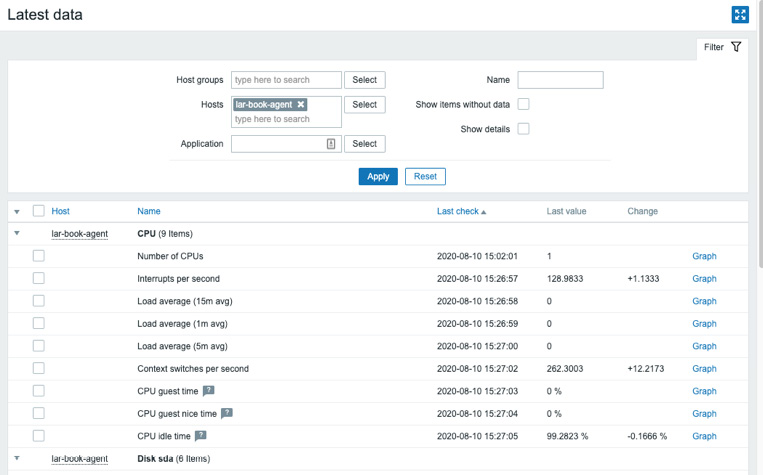
Figure 2.4 – The Zabbix latest data page for host lar-book-agent
Using a Zabbix agent in Active mode
Now let's check out how to configure the Zabbix agent with active checks. We need to change some values on the monitored Linux server host side:
- Start by executing the following command:
vim /etc/zabbix/zabbix_agent2.conf
- Now let's edit the following value to change this host to an active agent:
ServerActive=127.0.0.1
- Change
ServerActiveto the IP of the Zabbix server that will monitor this passive agent and also changeHostnametolar-book-agent:Hostname=lar-book-agent
- Now restart the Zabbix agent 2 process:
systemctl restart zabbix-agent2.service
- Now move to the frontend of your Zabbix server and let's add another host with a template to do active checks instead of passive ones.
- First, let's rename our passive host. To do that, go to Configuration | Hosts in your Zabbix frontend and click the host we just created. Change Host name as follows:

Figure 2.5 – The Zabbix host configuration page for host lar-book-agent_passive
We are doing this because for an active Zabbix agent, the hostname in the file needs to match our Zabbix server.
- Go to Configuration | Hosts in your Zabbix frontend and click Create host in the top-right corner.
- Now let's create the host as follows:

Figure 2.6 – The Zabbix host configuration page for host lar-book-agent
- Also, make sure to add the correct template, named
Template OS Linux by Zabbix agent active:
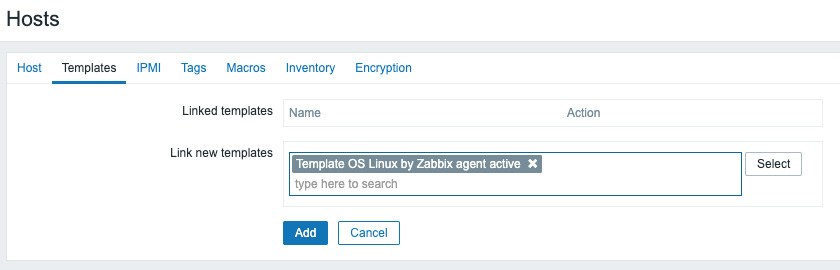
Figure 2.7 – The Zabbix host template page for host lar-book-agent
Please note that the ZBX icon won't turn green for an active agent. But when we navigate to Monitoring | Hosts and check Latest data, we can see our active data coming in.
Tip
As you might have noticed just now, a Zabbix agent can run in both passive and active mode. Keep this in mind when creating your Zabbix agent templates, as you might want to combine the check types.
How it works…
Now that we have configured our Zabbix agents and know how they should be set up, let's see how the different modes work.
Passive agent
The passive agent works by collecting data from our host with the Zabbix agent. Every time an item on our host reaches its interval, the Zabbix server asks the Zabbix agent what the value is now:
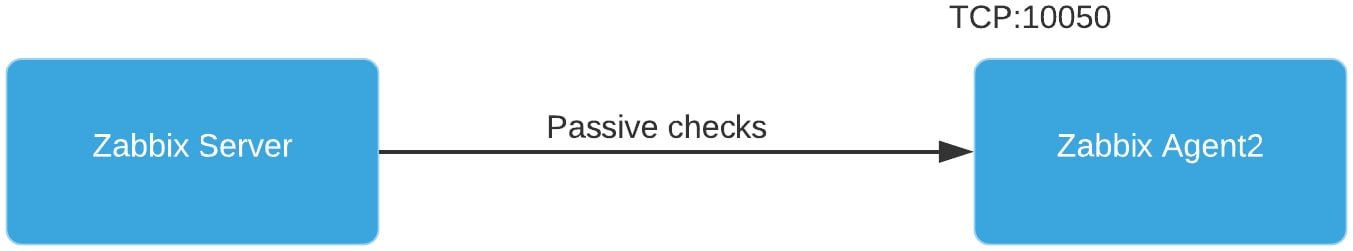
Figure 2.8 – Communication diagram between server and passive agent
Active agent
The active agent works by sending data from the Zabbix agent to Zabbix server. Every time an item on our agent reaches its update interval, the agent will send the value to our server. We can also use this to send a notification to our server faster when something goes wrong:
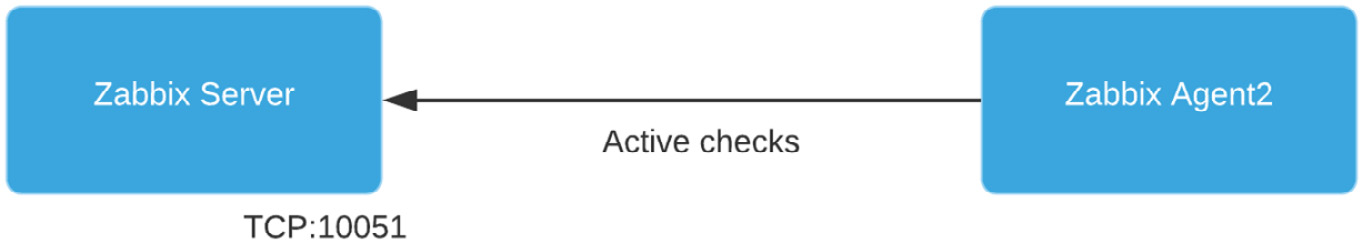
Figure 2.9 – Communication diagram between server and active agent
As mentioned, we can use both types of checks at the same time, giving us the freedom to configure every type of check we could possibly need. Our setup would then look like this:
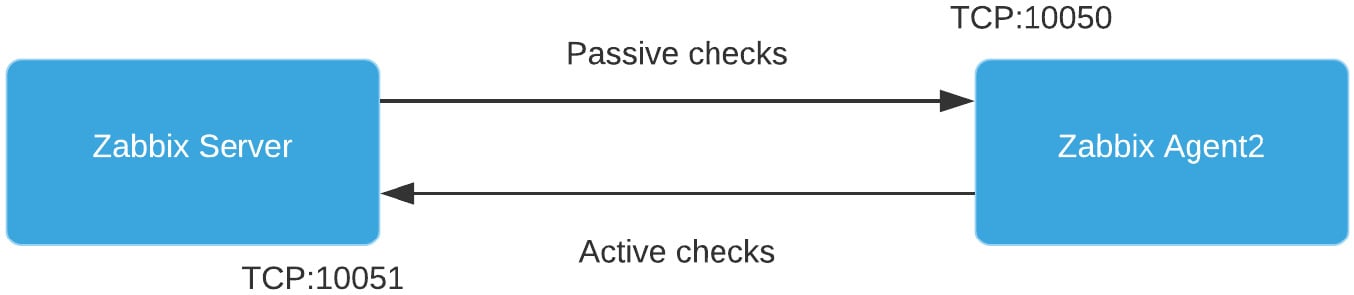
Figure 2.10 – Communication diagram between server and both agent types
See also
There's a lot of new stuff going on under the hood of Zabbix agent 2; if you're interested in learning more about the core of Zabbix agent 2, check out this cool blog post by Alexey Petrov: https://blog.zabbix.com/magic-of-new-zabbix-agent/8460/.