Sign In Start Free Trial
Account

Add to playlist

Create a Playlist

Modal Close icon
You need to login to use this feature.
  • Book Overview & Buying Web Application Development with R Using Shiny Second Edition
  • Table Of Contents Toc
Web Application Development with R Using Shiny Second Edition

Web Application Development with R Using Shiny Second Edition - Second Edition

By : Chris Beeley
3.5 (10)
close
close
Web Application Development with R Using Shiny Second Edition

Web Application Development with R Using Shiny Second Edition

3.5 (10)
By: Chris Beeley

Overview of this book

R is a highly flexible and powerful tool for analyzing and visualizing data. Most of the applications built using various libraries with R are desktop-based. But what if you want to go on the web? Here comes Shiny to your rescue! Shiny allows you to create interactive web applications using the excellent analytical and graphical capabilities of R. This book will guide you through basic data management and analysis with R through your first Shiny application, and then show you how to integrate Shiny applications with your own web pages. Finally, you will learn how to finely control the inputs and outputs of your application, along with using other packages to build state-of-the-art applications, including dashboards.
Table of Contents (9 chapters)
close
close
8
Index

d3heatmap


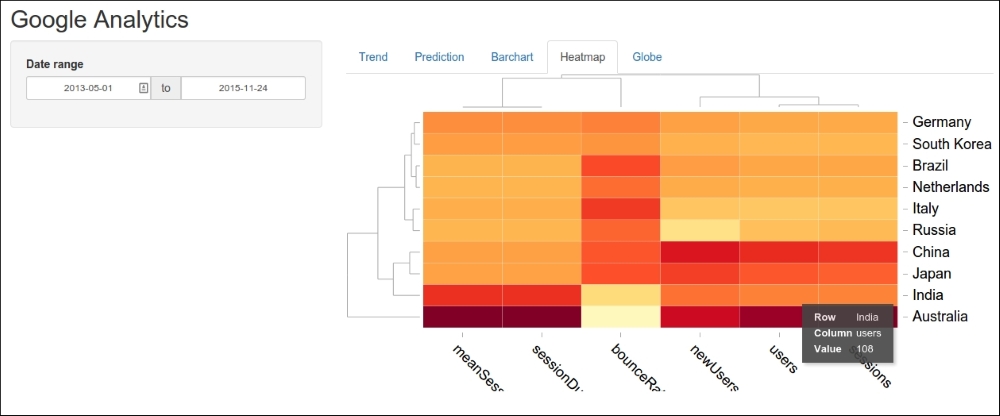
The d3heatmap package uses vanilla D3 and produces interactive heatmaps. It can be installed using install.packages("d3heatmap"). The output looks like the following screenshot:

In the preceding screenshot, several variables are plotted (arranged along the x axis) for 10 countries (arranged along the y axis). Mouseover is supported, as shown in the preceding screenshot, with the result for users in India that is highlighted (108). The code is as follows:

output$ui_heatmap <- renderUI({
  d3heatmapOutput("heatmap")
})

The first thing to note that, as discussed at the beginning of this chapter, is that it is necessary to draw the UI in a reactive context. This is because the JavaScript functions from the rCharts (NVD3) output interfere with the JavaScript (D3) from this output. Providing a reactive context for the UI ensures that this output is redrawn and allows the plot to be displayed properly. This is quite simple, as we merely need to wrap the standard d3heatmap() output function...

CONTINUE READING
83
Tech Concepts
36
Programming languages
73
Tech Tools
Icon Unlimited access to the largest independent learning library in tech of over 8,000 expert-authored tech books and videos.
Icon Innovative learning tools, including AI book assistants, code context explainers, and text-to-speech.
Icon 50+ new titles added per month and exclusive early access to books as they are being written.
Web Application Development with R Using Shiny Second Edition
notes
bookmark Notes and Bookmarks search Search in title playlist Add to playlist download Download options font-size Font size

Change the font size

margin-width Margin width

Change margin width

day-mode Day/Sepia/Night Modes

Change background colour

Close icon Search
Country selected

Close icon Your notes and bookmarks

Confirmation

Modal Close icon
claim successful

Buy this book with your credits?

Modal Close icon
Are you sure you want to buy this book with one of your credits?
Close
YES, BUY

Submit Your Feedback

Modal Close icon
Modal Close icon
Modal Close icon