

In this recipe, you will learn how to make histograms and density plots, which are useful to look at the distribution of values in a dataset.
The simplest way to demonstrate the use of a histogram is to show a normal distribution:
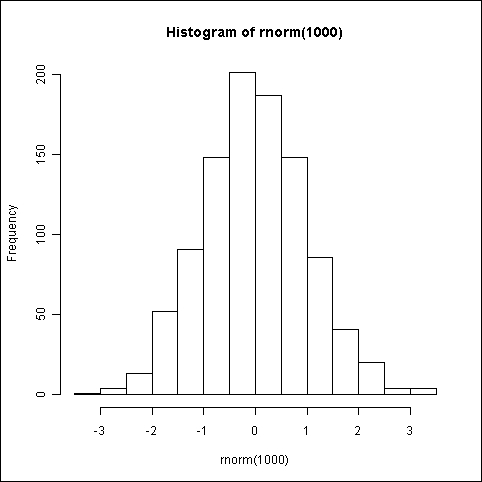
hist(rnorm(1000))
Another example of a histogram is one that shows a skewed distribution:
hist(islands)

The
hist() function is also a function of R's base graphics library. It takes only one compulsory argument, that is, the variable whose distribution of values we wish to visualize.
In the first example, we passed the rnorm() function as the variable. The rnorm(1000) function generates a vector of 1000 random numbers with a normal distribution. As you can see in the histogram, it's a bell-shaped curve.
In the second example, we passed the built-in islands dataset (which gives the areas of the world's major landmasses) as the argument to hist(). As you can see from these histograms, islands has a distribution...