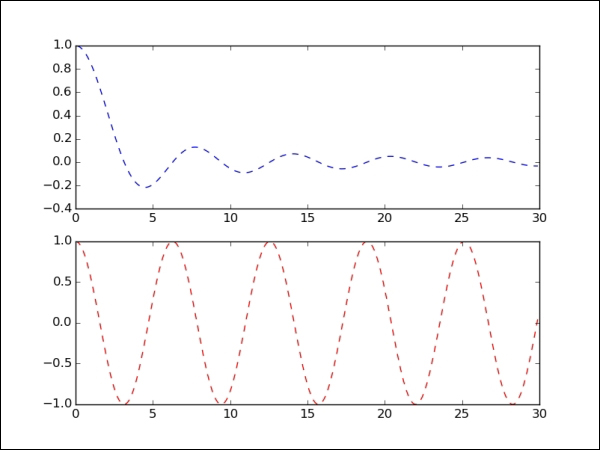

One very useful feature of matplotlib is that it makes it easy to plot multiple plots, which can be compared to each other:
>>> p1 = np.arange(0.0, 30.0, 0.1)

>>> plt.subplot(211)
>>> plt.plot(p1, np.sin(p1)/p1, 'b--')

>>> plt.subplot(212)
>>> plt.plot(p1, np.cos(p1), 'r--')
>>> plt.show()
In the preceding code, we use a subplot function is used to plot multiple plots that need to be compared. A subplot with a value of 211 means that there will be two rows, one column, and one figure: