Sign In Start Free Trial
Account

Add to playlist

Create a Playlist

Modal Close icon
You need to login to use this feature.
  • Book Overview & Buying Mastering Probabilistic Graphical Models with Python
  • Table Of Contents Toc
Mastering Probabilistic Graphical Models with Python

Mastering Probabilistic Graphical Models with Python

By : Ankur Ankan
3.3 (7)
close
close
Mastering Probabilistic Graphical Models with Python

Mastering Probabilistic Graphical Models with Python

3.3 (7)
By: Ankur Ankan

Overview of this book

Probabilistic Graphical Models is a technique in machine learning that uses the concepts of graph theory to compactly represent and optimally predict values in our data problems. In real world problems, it's often difficult to select the appropriate graphical model as well as the appropriate inference algorithm, which can make a huge difference in computation time and accuracy. Thus, it is crucial to know the working details of these algorithms. This book starts with the basics of probability theory and graph theory, then goes on to discuss various models and inference algorithms. All the different types of models are discussed along with code examples to create and modify them, and also to run different inference algorithms on them. There is a complete chapter devoted to the most widely used networks Naive Bayes Model and Hidden Markov Models (HMMs). These models have been thoroughly discussed using real-world examples.
Table of Contents (9 chapters)
close
close
8
Index

Conditional probability distribution

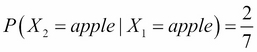
Let's take an example to understand conditional probability better. Let's say we have a bag containing three apples and five oranges, and we want to randomly take out fruits from the bag one at a time without replacing them. Also, the random variables Conditional probability distribution and Conditional probability distribution represent the outcomes in the first try and second try respectively. So, as there are three apples and five oranges in the bag initially, Conditional probability distribution and Conditional probability distribution. Now, let's say that in our first attempt we got an orange. Now, we cannot simply represent the probability of getting an apple or orange in our second attempt. The probabilities in the second attempt will depend on the outcome of our first attempt and therefore, we use conditional probability to represent such cases. Now, in the second attempt, we will have the following probabilities that depend on the outcome of our first try: Conditional probability distribution, Conditional probability distribution, Conditional probability distribution, and Conditional probability distribution.

The Conditional Probability Distribution (CPD) of two variables Conditional probability distribution and Conditional probability distribution can be represented as Conditional probability distribution, representing the probability of Conditional probability distribution given Conditional probability distribution that is the probability of Conditional probability distribution after the event Conditional probability distribution has occurred and we know it's outcome. Similarly, we can have Conditional probability distribution representing the probability of Conditional probability distribution after having an observation for Conditional probability distribution.

The simplest representation of CPD is tabular CPD. In a tabular CPD, we construct a table containing all the possible combinations of different states of the random variables and the probabilities corresponding to these states. Let's consider the earlier restaurant example.

Let's begin by representing the marginal distribution of the quality of food with Q. As we mentioned earlier, it can be categorized into three values {good, bad, average}. For example, P(Q) can be represented in the tabular form as follows:

Quality

P(Q)

Good

0.3

Normal

0.5

Bad

0.2

Similarly, let's say P(L) is the probability distribution of the location of the restaurant. Its CPD can be represented as follows:

Location

P(L)

Good

0.6

Bad

0.4

As the cost of restaurant C depends on both the quality of food Q and its location L, we will be considering P(C | Q, L), which is the conditional distribution of C, given Q and L:

Location

Good

Bad

Quality

Good

Normal

Bad

Good

Normal

Bad

Cost


High

0.8

0.6

0.1

0.6

0.6

0.05

Low

0.2

0.4

0.9

0.4

0.4

0.95

Representing CPDs using pgmpy

Let's first see how to represent the tabular CPD using pgmpy for variables that have no conditional variables:

In [1]: from pgmpy.factors import TabularCPD

# For creating a TabularCPD object we need to pass three
# arguments: the variable name, its cardinality that is the number
# of states of the random variable and the probability value
# corresponding each state.
In [2]: quality = TabularCPD(variable='Quality',
                             variable_card=3,
                                values=[[0.3], [0.5], [0.2]])
In [3]: print(quality)
╒════════════════╤═════╕
│ ['Quality', 0] │ 0.3 │
├────────────────┼─────┤
│ ['Quality', 1] │ 0.5 │
├────────────────┼─────┤
│ ['Quality', 2] │ 0.2 │
╘════════════════╧═════╛
In [4]: quality.variables
Out[4]: OrderedDict([('Quality', [State(var='Quality', state=0), 
                                  State(var='Quality', state=1), 
                                  State(var='Quality', state=2)])])

In [5]: quality.cardinality
Out[5]: array([3])

In [6]: quality.values
Out[6]: array([0.3, 0.5, 0.2])

You can see here that the values of the CPD are a 1D array instead of a 2D array, which you passed as an argument. Actually, pgmpy internally stores the values of the TabularCPD as a flattened numpy array. We will see the reason for this in the next chapter.

In [7]: location = TabularCPD(variable='Location',
                              variable_card=2,
                              values=[[0.6], [0.4]])
In [8]: print(location)
╒═════════════════╤═════╕
│ ['Location', 0] │ 0.6 │
├─────────────────┼─────┤
│ ['Location', 1] │ 0.4 │
╘═════════════════╧═════╛

However, when we have conditional variables, we also need to specify them and the cardinality of those variables. Let's define the TabularCPD for the cost variable:

In [9]: cost = TabularCPD(
                      variable='Cost',
                      variable_card=2,
                      values=[[0.8, 0.6, 0.1, 0.6, 0.6, 0.05],
                              [0.2, 0.4, 0.9, 0.4, 0.4, 0.95]],
                      evidence=['Q', 'L'],
                      evidence_card=[3, 2])
CONTINUE READING
83
Tech Concepts
36
Programming languages
73
Tech Tools
Icon Unlimited access to the largest independent learning library in tech of over 8,000 expert-authored tech books and videos.
Icon Innovative learning tools, including AI book assistants, code context explainers, and text-to-speech.
Icon 50+ new titles added per month and exclusive early access to books as they are being written.
Mastering Probabilistic Graphical Models with Python
notes
bookmark Notes and Bookmarks search Search in title playlist Add to playlist font-size Font size

Change the font size

margin-width Margin width

Change margin width

day-mode Day/Sepia/Night Modes

Change background colour

Close icon Search
Country selected

Close icon Your notes and bookmarks

Confirmation

Modal Close icon
claim successful

Buy this book with your credits?

Modal Close icon
Are you sure you want to buy this book with one of your credits?
Close
YES, BUY

Submit Your Feedback

Modal Close icon
Modal Close icon
Modal Close icon