Book Image

Jupyter for Data Science

By : Dan Toomey
Book Image

Jupyter for Data Science

By: Dan Toomey

Overview of this book

Jupyter Notebook is a web-based environment that enables interactive computing in notebook documents. It allows you to create documents that contain live code, equations, and visualizations. This book is a comprehensive guide to getting started with data science using the popular Jupyter notebook. If you are familiar with Jupyter notebook and want to learn how to use its capabilities to perform various data science tasks, this is the book for you! From data exploration to visualization, this book will take you through every step of the way in implementing an effective data science pipeline using Jupyter. You will also see how you can utilize Jupyter's features to share your documents and codes with your colleagues. The book also explains how Python 3, R, and Julia can be integrated with Jupyter for various data science tasks. By the end of this book, you will comfortably leverage the power of Jupyter to perform various tasks in data science successfully.
Table of Contents (17 chapters)
Title Page
Credits
About the Author
About the Reviewers
www.PacktPub.com
Customer Feedback
Preface

Expanding on panda data frames in Jupyter


There are more functions built-in for working with data frames than we have used so far. If we were to take one of the data frames from a prior example in this chapter, the Titanic dataset from an Excel file, we could use additional functions to help portray and work with the dataset.

As a repeat, we load the dataset using the script:

import pandas as pddf = pd.read_excel('http://biostat.mc.vanderbilt.edu/wiki/pub/Main/DataSets/titanic3.xls')

We can then inspect the data frame using the info function, which displays the characteristics of the data frame:

df.info()

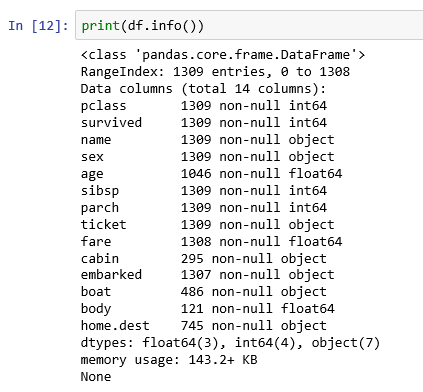
Some of the interesting points are as follows:

  • 1309 entries
  • 14 columns
  • Not many fields with valid data in the body column—most were lost
  • Does give a good overview of the types of data involved

We can also use the describe function, which gives us a statistical breakdown of the number columns in the data frame.

df.describe()

This produces the following tabular display:

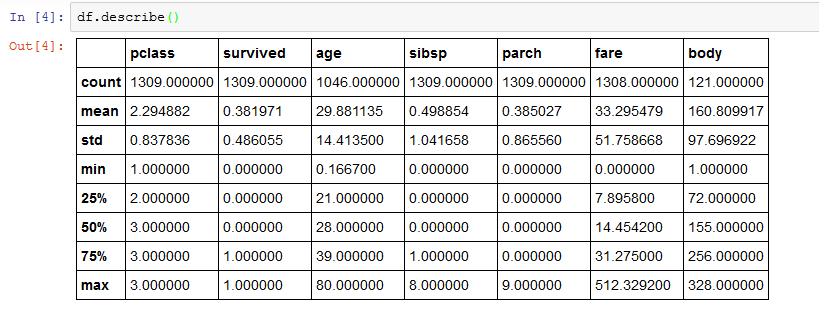
For each numerical column we have...